How to investigate spikes in total object count and meshes observed in the profiler?
I'm seeing gfx.waitforpresent spikes in the profiler, every couple of seconds or so. I'm sure it's a mistake on my part generating a ton of objects somewhere and then gradually destroying them before the next spike, where they're created again. How can I investigate this to pin down where the objects are coming from?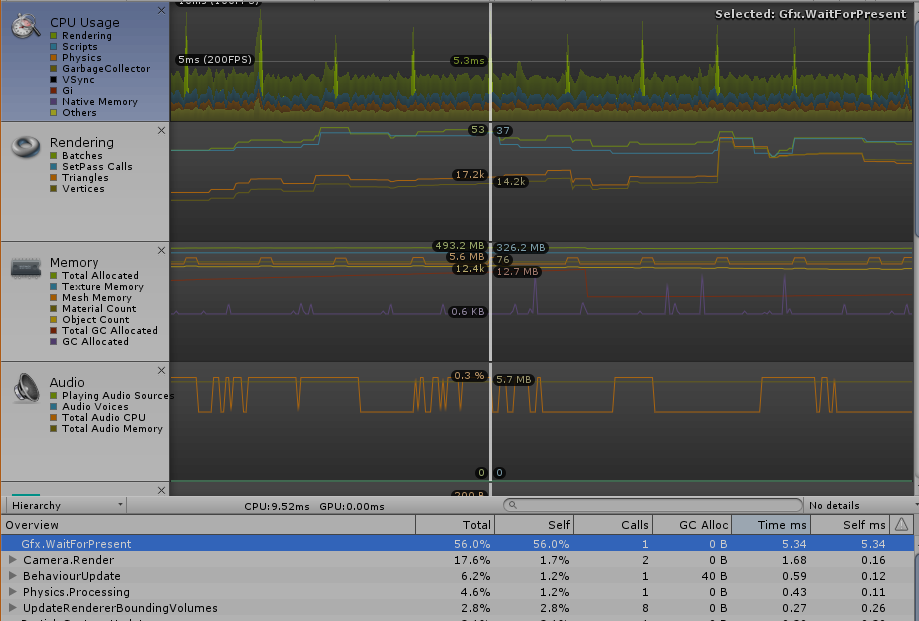
See the image below. When gfx.waitforpresent spikes up, that frame has double the meshes from the previous frame, and 100 more total game objects versus the previous frame as well. Can I somehow use the profiler or other tools to profile what objects or meshes exist in a selected game frame? I want to dig deeper but I'm unsure how to proceed.
