- Home /
Garbage Collection (StackTraceUtility) - Profiler Spikes
Hello everyone.
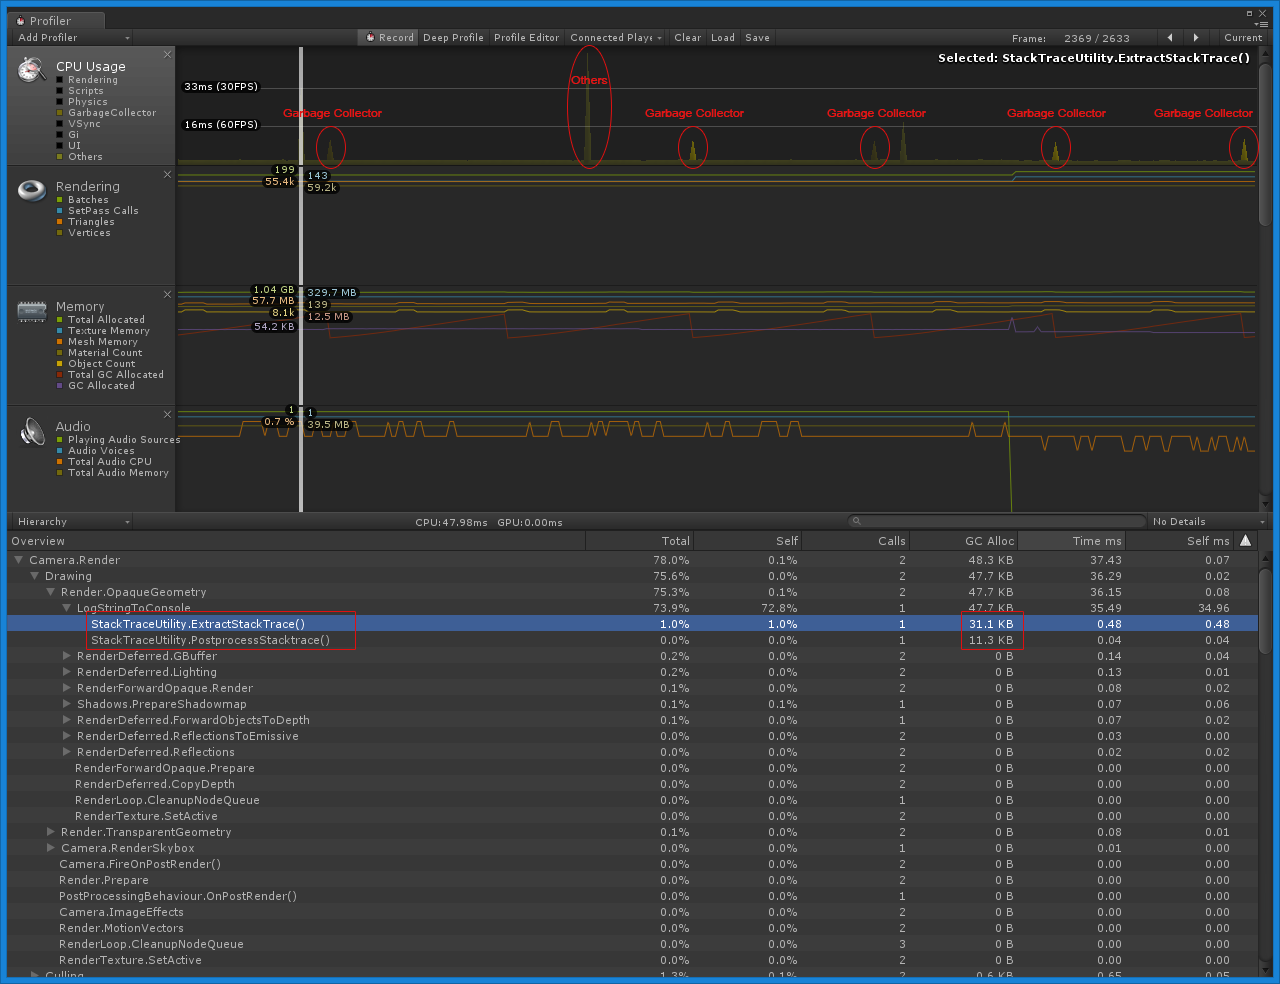
Whenever I profile my game I keep getting Garbage spikes. I checked and the most Garbage comes from something called 'StackTraceUtility'. And I also get huge random spikes from 'Others'. Is it also part of Garbage Collection?
I checked about this on the internet, but haven't found much useful information. Can someone please give some tips on how can I fix / avoid this annoying issue? Thank you!
Profiler: 
After Deep Profile: 
Answer by Bunny83 · Oct 04, 2017 at 12:50 PM
Do you have any Debug.Logs somewhere in your code which are executed every frame? Debug.Log has a huge hit on performance, especially inside the Editor. Each log has a full stacktrace which can be viewed in the console. Avoid using Debug.Log every frame. This should only be done temporarily for debugging purposes and removed immediately after.
You may have other things in your code which is generating garbage. You can switch the profiler into "deep profiling mode". This mode has a much larger impact on the performance in the editor, but it tells you exactly which method is being executed how many times a frame and how much memory got allocated by each method. This should help to track down what is generating garbage.
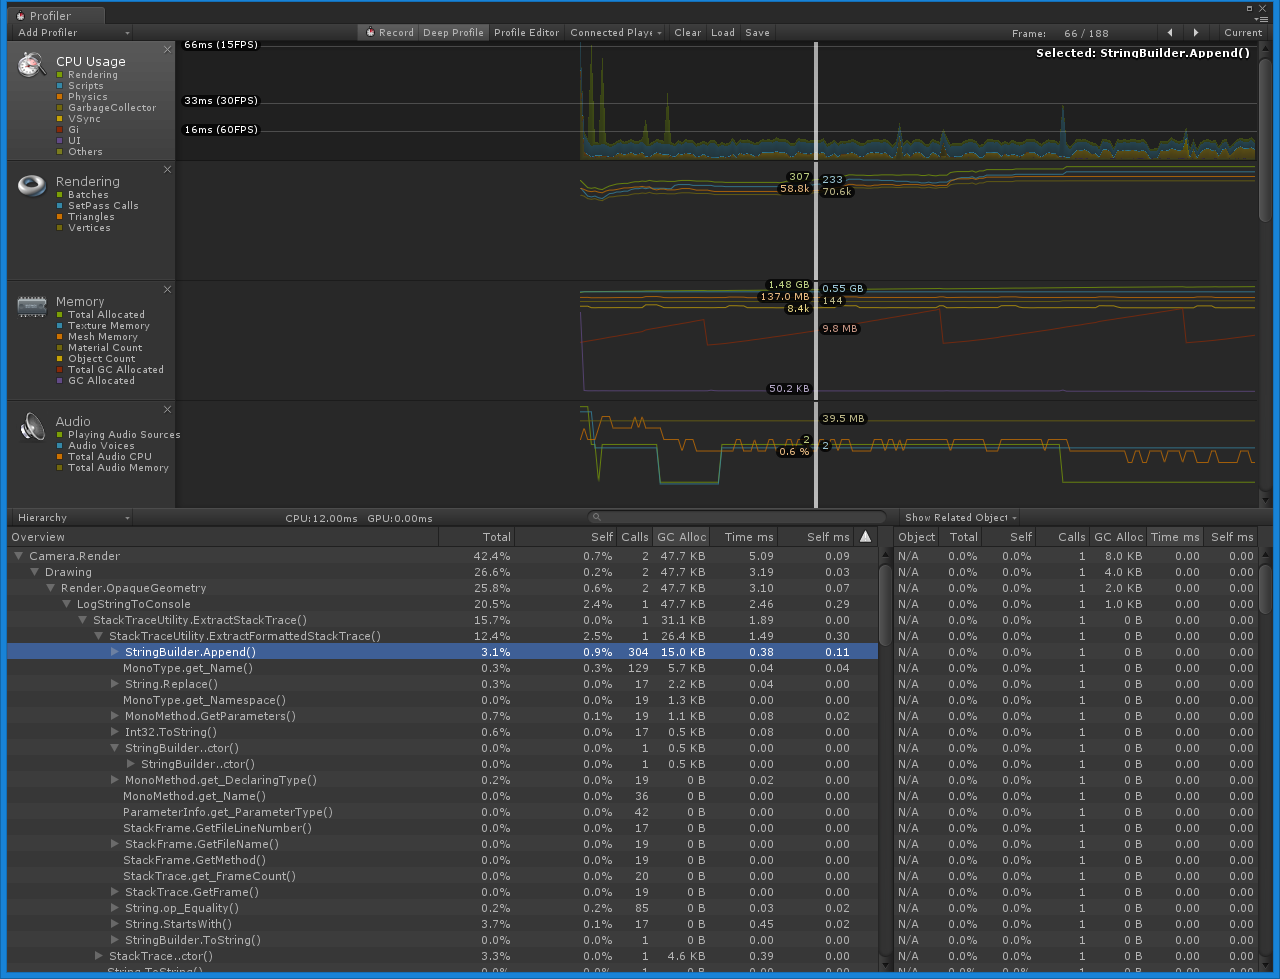
Thank you for the answer! :) I haven't called any Debug.Log. The console is empty. I tried to deep profile my game and I got some more 'detail' information, but I still can't understand what is causing the problem.. (The source of the issue). Could you maybe take a look?
After Deep Profile: 
Well, it seems the log is generated from the rendering thread due to some issues during rendering. Have a look at this forum post. It seems that it is possible that those errors doesn't show up in the console but are only dumped into the editor log. Have a look at the editor log when it happens. You may want to restart Unity before this test to get a clear editor log.
Your answer

