Memory usage in Profiler
Hey everyone, how do we know the actual amount of memory is being used in a game?
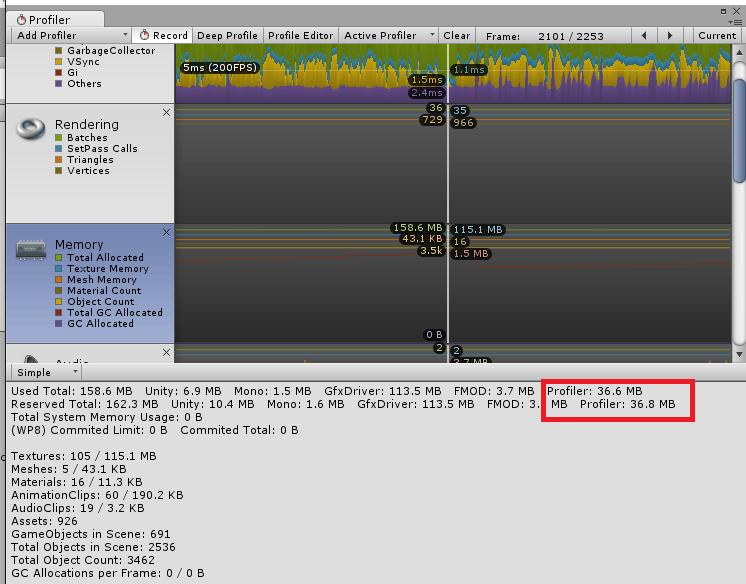
I build and run the game on my android device, it's a development build and it autoconnects the profiler.
Based on the image below, the PROFILER itself shows that it actually uses around 36mb of memory while running the game.
My question is that does that happens in the RELEASE build? Does it mean that the accurate memory usage would be DEDUCTING the PROIFLER MEMORY USAGE from the total memory usage in development build?
I have googled and I couldnt find an answer.
Thanks for the help guys.
