What does "other" in the Profiler Stand for?
Hello Everyone,
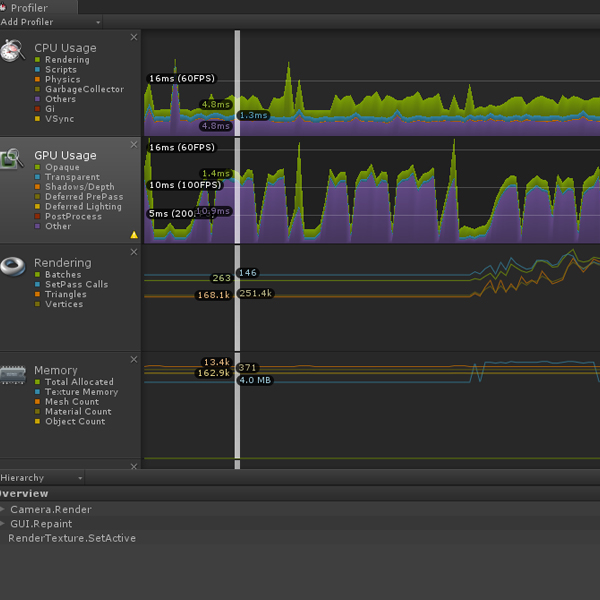
I am currently trying to squeeze every frame I can out of my current project but I have come across a small issue. In the profiler the only infomation that I am being given is that the a large amout of reasorces are bing taken up by "other" in the GPU and "others" in the cpu. I just wanted to know if anyone knew what this "other" and "others" is, and what would I need to do about lowering this in my project.
thanks
High others can often mean there is a bug in your code, such as an undefined Transform, GameObject, or Rigidbody. If you are instantiating objects, make double sure that they are defined, or a major slowdown will occur.
The manual page for CPU Usage Area states for others as:
The Others section of the CPU profiler records the total of all areas that do not fall into Renderer, Scripts, Physics, Garbage Collection or VSync. This includes Animation, AI, Audio, Particles, Networking, Loading, and PlayerLoop.
Similarly Others under GPU can be anything that does not fall into the remaining listed categories. It can be even something like uploading graphics to textures.
Thanks, looking at it, could it be loading in game objects? like from culling?
is there anywhere else with infomation as these can be a little vage
In my case "Others" simply was EditorLoop. If you click on EditorLoop the others chart area is highlighted. If you click on PlayerLoop then it is dehighlighted which indicates the same.
In my experience, it's most commonly waiting for vSync.
In my case under the "other" section was post processing effect attached to the camera.
