Wayback Machinekoobas.hobune.stream
May JUN Jul
Previous capture 12 Next capture
2021 2022 2023
1 capture
12 Jun 22 - 12 Jun 22
sparklines
Close Help
  • Products
  • Solutions
  • Made with Unity
  • Learning
  • Support & Services
  • Community
  • Asset Store
  • Get Unity

UNITY ACCOUNT

You need a Unity Account to shop in the Online and Asset Stores, participate in the Unity Community and manage your license portfolio. Login Create account
  • Blog
  • Forums
  • Answers
  • Evangelists
  • User Groups
  • Beta Program
  • Advisory Panel

Navigation

  • Home
  • Products
  • Solutions
  • Made with Unity
  • Learning
  • Support & Services
  • Community
    • Blog
    • Forums
    • Answers
    • Evangelists
    • User Groups
    • Beta Program
    • Advisory Panel

Unity account

You need a Unity Account to shop in the Online and Asset Stores, participate in the Unity Community and manage your license portfolio. Login Create account

Language

  • Chinese
  • Spanish
  • Japanese
  • Korean
  • Portuguese
  • Ask a question
  • Spaces
    • Default
    • Help Room
    • META
    • Moderators
    • Topics
    • Questions
    • Users
    • Badges
  • Home /
avatar image
1
Question by seanybaby2 · Apr 05, 2016 at 03:24 PM · 2d gameprofilerperformance optimization

Performance Drop on Integrated GPU Computers - GPU (Other) appears to be the source of issue.

We're having some serious performance issues for users with integrated graphics cards. They're able to fix these performance issues by lowering the resolution of their computers. After taking a look at the Deep Profile. Signs appear to all be pointing to GPU (Other). After doing some digging we discovered that Other accounts for the Editor, VSYNC, and other GPU related things. We know that we're not using VSYNC, and that the performance issues are similar outside of the editor.

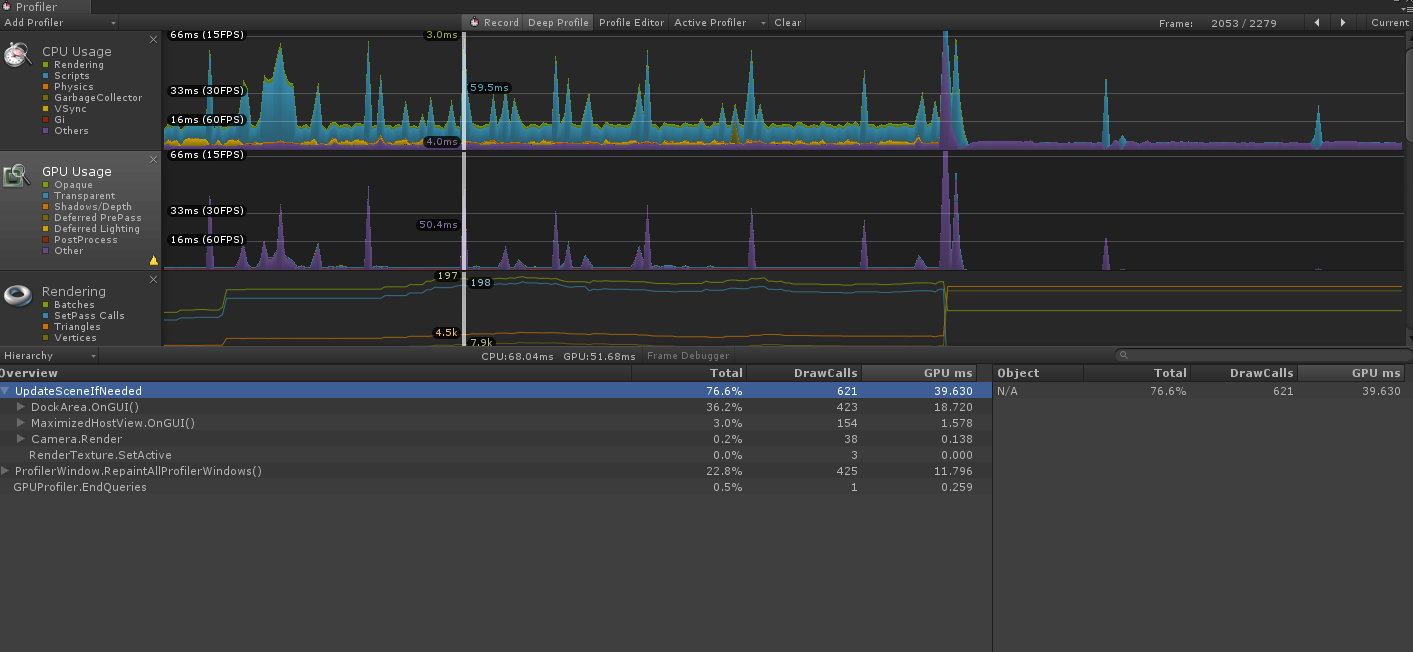
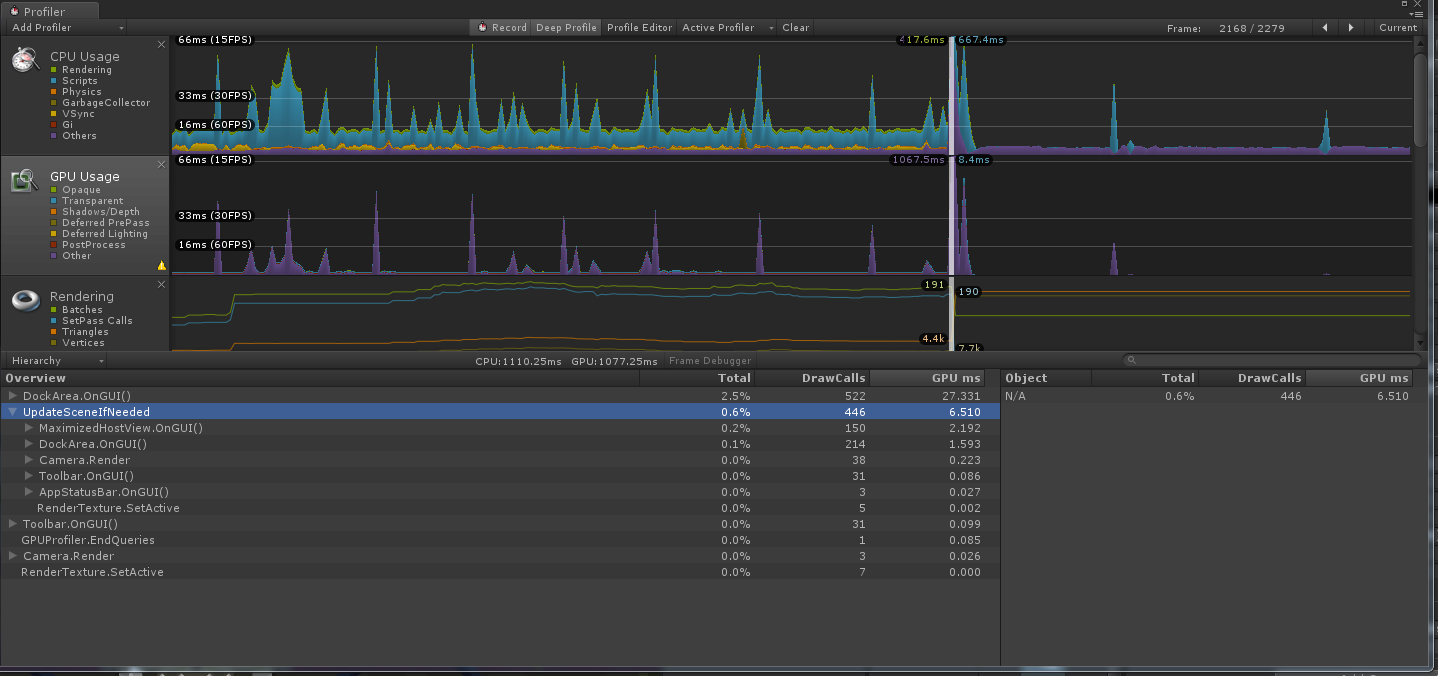
We noticed a few functions that were called a lot profiler under the GPU. UpdateSceneIfNeeded. DockArea.OnGUI()

Could any of these functions be related to the issue? I notice there are still a lot of performance hits in Other that arn't being accounted for on other frames as well.

Here is are some screenshots of our profiler.

alt text

alt text

On a side note our game is made in 2D.

Thank you for your help in advanced!

profiler2.png (161.8 kB)
profiler.png (133.6 kB)
Comment
Add comment · Show 4
10 |3000 characters needed characters left characters exceeded
▼
  • Viewable by all users
  • Viewable by moderators
  • Viewable by moderators and the original poster
  • Advanced visibility
Viewable by all users
avatar image meat5000 ♦ · Apr 05, 2016 at 03:29 PM 0
Share

Integrated graphics cards. You've already answered your question.

The majority of IGCs are Intel and its common knowledge that they are simply a big bag of rotting dog-poopoo. With green bits.

I couldn't even run Broforce on that last IGC I had.

If you can repeat your test on an NVidia IGC then we'd have a starting point.

I'd worry more about whats going on in those script spikes.

avatar image seanybaby2 meat5000 ♦ · Apr 05, 2016 at 04:56 PM 0
Share

Thank you for your input but this answer does not help. We're aware that the game is running slow on IGCs but that isn't my question. $$anonymous$$y question is how to make it run fast on Integrated Graphics card like Intels HD 4000. Which is our current benchmark. $$anonymous$$any of our consumers don't have external GPUS and expect the game to run well for there onboard GPUs. If a title like League of Legends can run 100 FPS on medium settings on an Intel HD 4000 we should be able to s$$anonymous$$dily perform at 60 FPS in a 2D environment on low settings. $$anonymous$$y questions is how do we get there with my current dilemma which appears to be related to the Graphics (other) in the profiler.

If you have any relatable information on this subject, your help would be much appreciated.

avatar image seanybaby2 meat5000 ♦ · Apr 05, 2016 at 05:05 PM 0
Share

Also I think it should be noted these profiler screen shots were taken with my GTX 970. When the tests are done with an Intel HD 4000. The GPU(other) takes around 200 $$anonymous$$S per frame. Sometimes spiking as high as 400 $$anonymous$$S, the CPU time is negligible at this point as the game runs at a s$$anonymous$$dy 60 FPS without these issues.

avatar image meat5000 ♦ seanybaby2 · Apr 06, 2016 at 10:33 AM 0
Share

But its labelled 667.4ms in blue on the script spike there. If you are seeing the performance issue with a GFX 970 then optimising for IGCs is not really the focus in my opinion. I mean, are these two things linked? Are you perfor$$anonymous$$g a lot of script operations that affect the GPU?

Do you use OnGUI in the game or is it just for editor/debugging etc? OnGUIs performance is quite terrible. Caused the devs to make a totally new system. Have you profiled a build? A lot of those draw calls are editor overhead it seems.

I used Broforce as my example as it was made in Unity3D. LoL was made with something else. It does help a lot to look at existing Unity games that are doing well to get a realistic idea of what can be achieved with the Engine.

I assume you've gone through the Graphics Performance Tips?

0 Replies

· Add your reply
  • Sort: 

Your answer

Hint: You can notify a user about this post by typing @username

Up to 2 attachments (including images) can be used with a maximum of 524.3 kB each and 1.0 MB total.

Follow this Question

Answers Answers and Comments

46 People are following this question.

avatar image avatar image avatar image avatar image avatar image avatar image avatar image avatar image avatar image avatar image avatar image avatar image avatar image avatar image avatar image avatar image avatar image avatar image avatar image avatar image avatar image avatar image avatar image avatar image avatar image avatar image avatar image avatar image avatar image avatar image avatar image avatar image avatar image avatar image avatar image avatar image avatar image avatar image avatar image avatar image avatar image avatar image avatar image avatar image avatar image avatar image

Related Questions

Reading Profiler Results 1 Answer

How to decrease Gfx.WaitForPresent? (2D) 1 Answer

WaitForTargetFPS slowing WebGL to unacceptable levels 1 Answer

Question regarding TileMap Performance 0 Answers

Problem with profiler spikes caused by Semaphore.WaitForSignal 0 Answers


Enterprise
Social Q&A

Social
Subscribe on YouTube social-youtube Follow on LinkedIn social-linkedin Follow on Twitter social-twitter Follow on Facebook social-facebook Follow on Instagram social-instagram

Footer

  • Purchase
    • Products
    • Subscription
    • Asset Store
    • Unity Gear
    • Resellers
  • Education
    • Students
    • Educators
    • Certification
    • Learn
    • Center of Excellence
  • Download
    • Unity
    • Beta Program
  • Unity Labs
    • Labs
    • Publications
  • Resources
    • Learn platform
    • Community
    • Documentation
    • Unity QA
    • FAQ
    • Services Status
    • Connect
  • About Unity
    • About Us
    • Blog
    • Events
    • Careers
    • Contact
    • Press
    • Partners
    • Affiliates
    • Security
Copyright © 2020 Unity Technologies
  • Legal
  • Privacy Policy
  • Cookies
  • Do Not Sell My Personal Information
  • Cookies Settings
"Unity", Unity logos, and other Unity trademarks are trademarks or registered trademarks of Unity Technologies or its affiliates in the U.S. and elsewhere (more info here). Other names or brands are trademarks of their respective owners.
  • Anonymous
  • Sign in
  • Create
  • Ask a question
  • Spaces
  • Default
  • Help Room
  • META
  • Moderators
  • Explore
  • Topics
  • Questions
  • Users
  • Badges