Profiling the editor
 Hello,
I am experiencing very low framerate in editor which occurs when I select a certain script for which I've written a custom Editor.
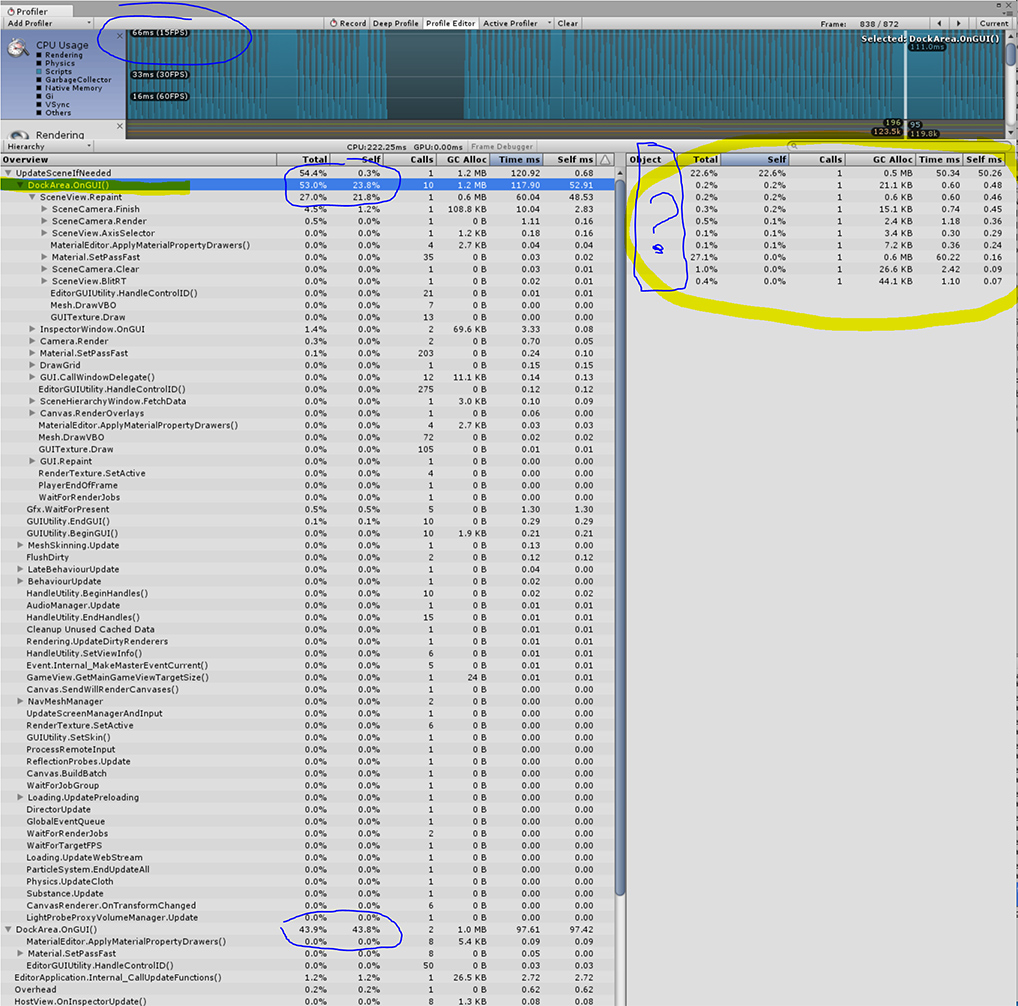
I am trying to profile in editor, however I can't see what causes such a huge delay and which line in my code is the problem. I just see the consequence "DockArea.OnGUI" being very large. Code doesn't use any Handles class
commenting out SceneView.RepaintAll() doesn't fix the issue :/
Is it possible to see which function exactly causes this stall?
Please find the image attached Thank you
Have you tried having "Deep profile" pressed while recording? Deep profile has a large overhead but it is still useful for giving a hint of where the problem is worst. You can also add Profiling.Profiler.BeginSample("MyPieceOfCode"); Profiling.Profiler.EndSample(); Around the code that you want to measure.
Thank you, deep profiling is really heavy in editor, but manageable.
However, I don't see "$$anonymous$$yPieceOfCode" in the dropdowns. Is it nested somewhere? I am pretty sure it should be there, because breakpoints are being hit if I set them in Visual Studio.
Yes it is nested within the method you placed the sample in, so if your sample is within OnInspectorGUI you will find it under "InspectorWindow" etc. If you disable "Deep profile" you will still see custom profile samples.
