GPU usage mismatch
I'm writing a scientific viewer framework, kinda, for the HTC Vive. I have a GeForce GTX 1080. Suppose I have a 25x25x25 array of transparent cubes. At those dimensions, rendering is a little jerky. I open the Unity Profiler, and both my CPU and GPU show as being maxed out. 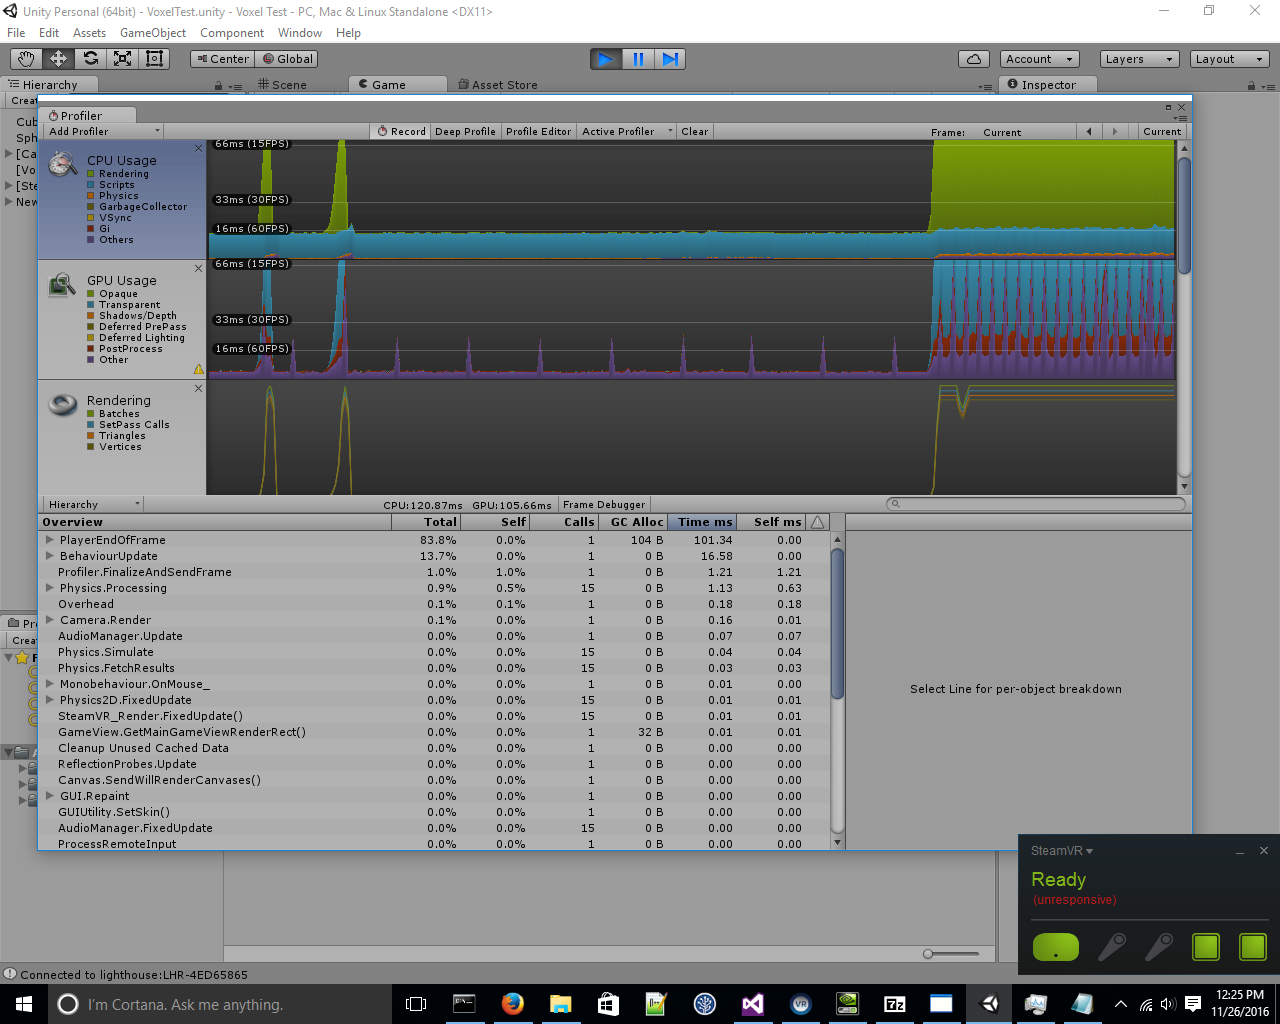 That's fine and all. However, nvidia-smi, NVIDIA's gpu monitoring program, shows the GPU usage staying at 7-13%. (Power and fan numbers support this.) I'm not sure that there's even any correlation with whether Unity is running.
 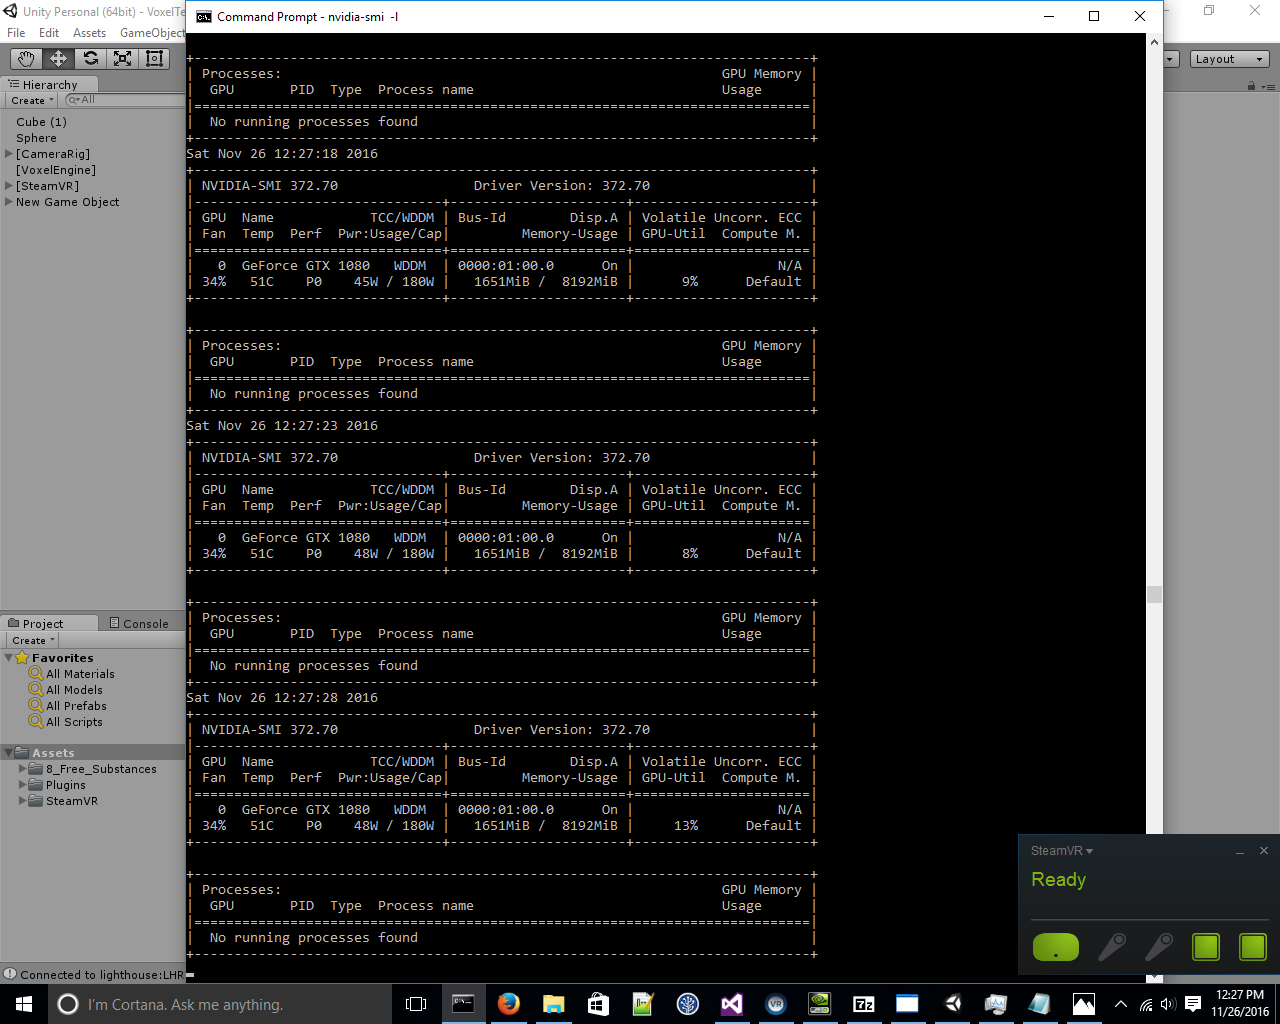 What I'd suspect is that Unity's not using my GeForce card, and instead using some built in thing or something. However, the log says otherwise:
GfxDevice: creating device client; threaded=1 Direct3D: Version: Direct3D 11.0 [level 11.0] Renderer: NVIDIA GeForce GTX 1080 (ID=0x1b80) Vendor: NVIDIA VRAM: 8144 MB
So if the logs say Unity's using my GeForce GPU, and Unity's profiler says it's maxing out the GPU, but NVIDIA's GPU monitor says it isn't, what's going on? And, hopefully, how can I get it to render faster? (And if anybody knows a fast way to render a block of additively transparent cubes, that'd be cool.)
Well the GPU usage in percent doesn't have to have any relation to how long certain processes take. There could be a lot overhead involved that slows down the overall processing. The GPU usage just refers to how much work the GPU cores currently do.
A good counter example would be a HDD. If it has a max write speed of say 300MB/s We measure the write-speed-usage based on that value. If however you write two or more large files "in parallel" the HDD head has to reposition after each block written as the different files would write alternating. The actual write speed you can now reach is much lower than the max possible. So even you only "use" say 10% of it's capabilities it simply doesn't go faster due to some sort of bottleneck.
In the case of the GPU that could have many reasons. Frequent flushing / reprogramming of the pipeline can be a problem.
May i ask how those cubes are actually rendered? Hopefully not has +15k gameobjects ^^. However since your "batches" line is that far up i might have hit the nail on the head ^^.
edit
I just had a quick look at your project (didn't download just browsed some files). As i guessed you created a batching and drawcall "nightmare" and your profiler results show exactly that. First of all having that many GameObjects is already kind of bad for performance. But in addition you individually modify every material directly which will instantiate a seperate material for each of your "voxels". If Unity would render 25³ (==15625) gameobjects seperately, it would be difficult to express your framerate in whole numbers. Luckily Unity usually does its best to batch things where possible. However setting different colors in the material will break batching.
Things like voxel systems are usually implemented by creating a large Mesh procedurally and just update the mesh (in your case just the vertex colors). As far as i have seen you're not doing very complex calculations. This might even be easier to implement in a shader so you wouldn't have to fiddle with each "voxel" manually on the CPU.
As i said i haven't downloaded your project so i don't even know what your voxel prefab looks like. Is it a cube or something else? A single Mesh in Unity can only have 65k vertices. If you have 25³ cubes that would be 25*25*25*24 == 375000 vertices. So you would need to split your "big cube" in at least 6 Mesh objects to cope with the the amount of vertices.
Depending on your target hardware if you have access to DX11 you could use a geometry shader to create the voxel-cubes inside the shader. So each voxel would only require a single vertex. Though that are many "unknowns" so it's difficult to suggest anything specific. What is clear is you have to:
avoid using that many seperate gameobjects.
use a single material and work with vertex parameters of the mesh(es).
Yeah, but even if it's a disk bottleneck or something, why does the Unity profiler say something different than the NVIDIA profiler? Unless maybe the Unity profiler is telling me something different - I notice it says things in ms, rather than %. Also, yepperoo, I'm rendering 15k game objects. (Though it's at least faster when I disable the ones that are entirely transparent.) Is there a better way of doing it, under the assumption that each voxel's color and transparency is independent of the ones around it, and changes from frame to frame?
Unity doesn't show you how much of you GPU is in use. It shows times how long it took to render frames. 16ms would be around 60fps. If you let it run for a while scale should change so it's not showing constantly full bar. As you can see from the bottom there is "PlayerEndOfFrame" that took 101.34ms to complete and that is much taller than the 66ms profiler is showing.
One reason for GPU to be on low usage is that it's just waiting for CPU to complete its task. And CPU might do pretty much everything on single core, depending on multithreading of your project.
Also, here's my code. https://github.com/Erhannis/VoxelFramework
Oh, ok; thanks. I'll try some of those things and see if I can get something working. 1. Yeah, the voxel prefab is a cube. 2. I infer, then, that you can have a disconnected mesh? 3. Is there an example somewhere of a shader doing something roughly related I could look at, that you know of? I'll try Googling "geometry shader", for now. 4. Also, note that I intend for a theoretical developer user (me, for now) to be able to specify voxel colors/alphas according to whatever arbitrary calculations they feel like (wave equation etc.), so hopefully the shader idea is still compatible.
Hey, so I adapted some shaders (from CharlesWillCodeIt) to do what I need - working significantly better, now. It occurs to me, though, that making my program faster was not my question, but rather my question was why the Unity profiler appeared to disagree with the NVIDIA profiler. I now suspect that the Unity profiler displays time per frame, rather than percentage, and when a bottleneck was reached, they both leveled out, thus appearing (due to scaling) like they were maxed out, when that's not the metric they display. Would you agree with that assessment?
