Debug a "code -1073741819 (0xc0000005) 'Access violation'" in a Windows Phone 8.1 Game
My game is crashing in random moments and when this happens Visual Studio does not throw any exceptions; actually, debugger still runs for a a minute or two and then this appears in the Output:
The program '[1752] Template.exe' has exited with code -1073741819 (0xc0000005) 'Access violation'.
I searched for the problem and seems it may have diverse causes. As visual studio does not break, I can not find the line in code where game crashes neither can I read the call stack.
I also tried to use the Dump File which is auto generated in Documents/Debug in Windows Phone. But a do not realize how to use it, I hit any of the Debug buttons and all of then fail to run.
So, is there a way for debugging Access Violations? (focusing in Windows Store Apps / Phone 8.1 games)?
(the dump file is in this link).
Let me know if any more info is needed.
Here are all the links I found by googling for a solution:
Windows Store & Phone - Exception in msvcr120d_app.dll
Locking then unlocking of device causes d3d error
d3d11.dll caused an Access Violation
64bit directx11 games with shaders crashes
OVRDisplayRT64.dll caused an Access Violation [UNITY CRASH
Looks like I found a workaround...
This is what appears in the minidump:
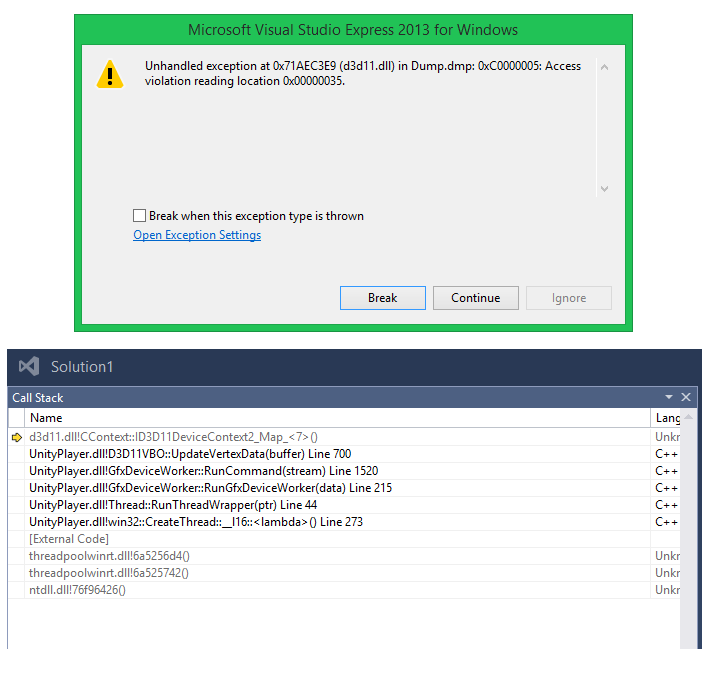
After googling a few days I reached a topic in Unity Forums where is suggested to add the following line of code at the end of App class constructor, in App.xaml.cs file, for better debugging:
appCallbacks.AddCommandLineArg("-force-gfx-direct");
(...) it will disable multithreaded renderer, so the stacktrace information will contain everything that lead up to the crash point.
Curiously, after doing that, no more crashes happened; I tested in a old backup which was easy to reproduce the crash. I know the real problem was not solved, but that access violation crash has gone...
Could it be a multi-threading problem? Would it be a bug? Could it be caused by game scripts?
