Phone getting too hot! Profiler shows nothing
Hi, and thanks for taking the time to read.
Firstly let me say that I've been reading optimization documentation for a few days now - and I still can't figure out what the cause of this issue is. I've tested on 6 different devices (iOS/Android) - each of which produce this issue.
I've found many threads highlighting this issue - but none that were conclusively answered - just vague suggestions that usually only go as far as "check the profiler to see what's going on, and then fix it." Although I understand you can only be so specific without seeing the project.
I have a relatively basic 2D game that uses Input.acceleration as an input. I have a dozen or so canvas elements (images, buttons), and a bit of networking using Photon.
The profiler shows absolutely nothing out of the ordinary - but after running the app for ~5 minutes, the phone gets significantly warmer. After 10+ minutes it gets hot, and a bit longer after that I can see that the phone is starting to limit the app's processes by lowering the frame rate.
Things I've tried:
Enabling/Disabling VSync
Setting target frame rate
Texture compression
Lowering quality settings to "Fastest"
Testing on several different devices
Checking memory allocation (it's around 114mb on iOS)
Lowering the increment at which I'm polling the accelerometer
Deep profiling from the device and editor
Thanks for the help!
Addyarb
Don't forget that Unity will be rendering whatever you are doing on the highest resolution the phone has and most phones nowadays have very high resolution screens.
Try this on the Start() function with VSync on:
Screen.SetResolution(1280, 720, true);
Yes this is most likely the reason. Lowering the resolution will lower the power consumption a great deal.
It did not work. I called Screen.SetResolution(1280, 720, true); but then the screen resolution is not changed at all.
Sorry, it was Unity's bug. I updated the lastest version and it worked.
Wow, this really helped me. Tried optimizing a ton of other stuff - to no avail, and this did the trick. Well, I guess I have a far better optimized game now overall :D
You could have to much going on every frame. Check all your scripts and see what is going on in each of the updates. Also if the script doesn't need the update function just delete as it still does get called every frame regardless. If you are constantly instantiating objects and destroying objects I would suggest you object pool, if you need a script for object pooling please let me know. Another problem could be to many rigidbodies in the scene at once.
Thanks for the suggestion. I have completely disabled my Update method, and the phone still gets warm after ~5 $$anonymous$$utes, although not nearly as warm/hot as it was before.
Attached is my profiler screenshot. During this build I completely removed the Update method. It seems GraphicsPresentAndSync is taking up quite a bit - but that may be normal. I'm only rendering 8 UI elements in this scene - so I can't imagine why it'd be heating up.
Are there any resources that actually define what I'm seeing in the profiler, or is it best just to google them one by one? 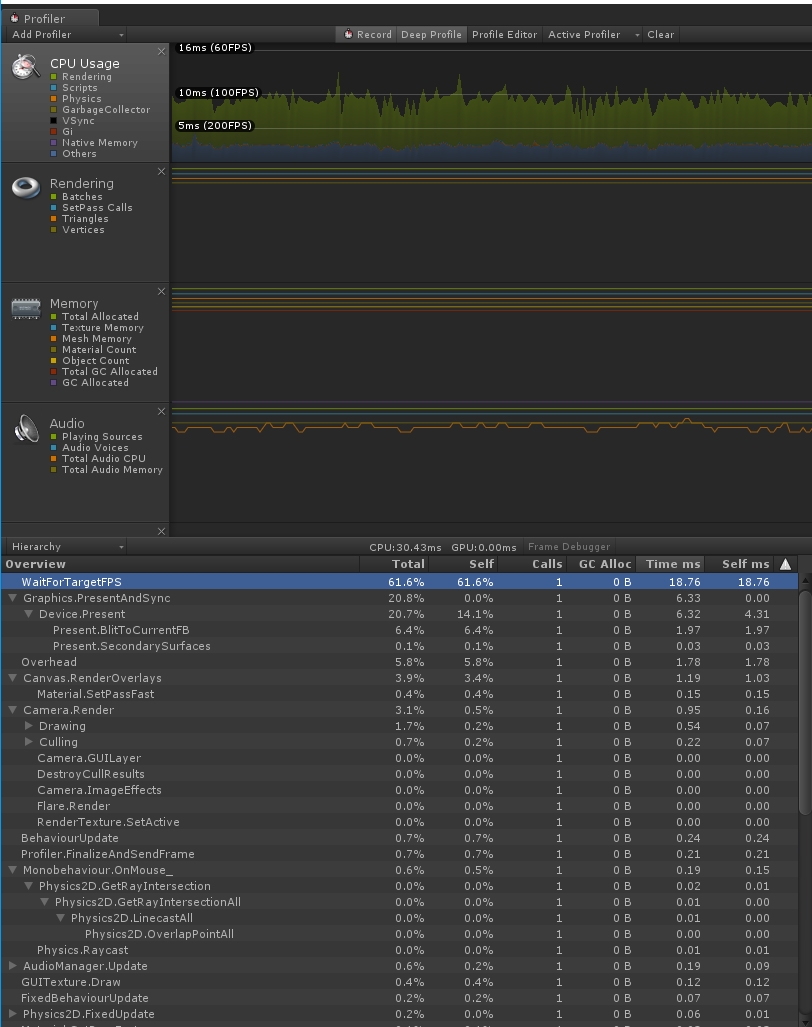
After some more testing, I've run into something very strange..
I created a new, empty scene in my app and added one Canvas with one Panel (Image that overlays the screen).
After building, putting it to 'Fastest' quality setting, disabling VSync, and deselecting the profiler / debug build - I launched the app and let it sit for 5 $$anonymous$$utes.
It ended up being just as warm as it was when I disabled the Update method.
What is going on here? Is this an inherent optimization issue with the Unity engine? I can't think of a more stripped down scene.
I tested this on a Samsung S5 and S6.
That is very strange. I did run into this problem awhile ago, but never really found a fix. But I decided not to worry about it yet and just keep testing the gameplay part, and eventually I magically fixed and my phone would no longer get really hot. Now I'm still very unsure as to what I did to make it stop my phone from overheating but maybe with some time and you update your game it might go away as it did for me.
Do you regularly update your Unity version? I'm on the latest version right now (5.5.0f3).
There's not much left for me to go on. I do know of plenty of games built with Unity (2D and 3D) that don't exhibit any excessive heating issues, and have loads more going on. I wish there was a baseline app (or baseline values) I could test against in situations like this.
Anyhow, I appreciate you taking the time to offer your thoughts. Thanks!
The magic keyword here is "VSync". You wrote you DISABLED VSync - which has the opposite effect of what you want to do: With vsync off, Unity will render AS FAS AS POSSIBLE, even if there is "nothing to do", or the screen elements are static. So you DEFINITELY want to enable vsync, or even set Application.targetFrameRate to something smaller manually, for example to 30 (=fps).
@addyarb I compared my cpu usage to yours on a game I have been working on, and wow your Rendering seems to be really high and abnormal. Could you send a screenshot of your scene view?
Try turning off pixel perfect in the canvas settings(If you don't already have done this), can't imagine anything else.
Btw, thanks cakeslice i think you have just solved my problem ^^
you can also reduce fixed time step, if you are running physics. make sure its not running faster than the fps ( unless it really has to )
