Unity iOS 13 Memory leak Crash
Hello!
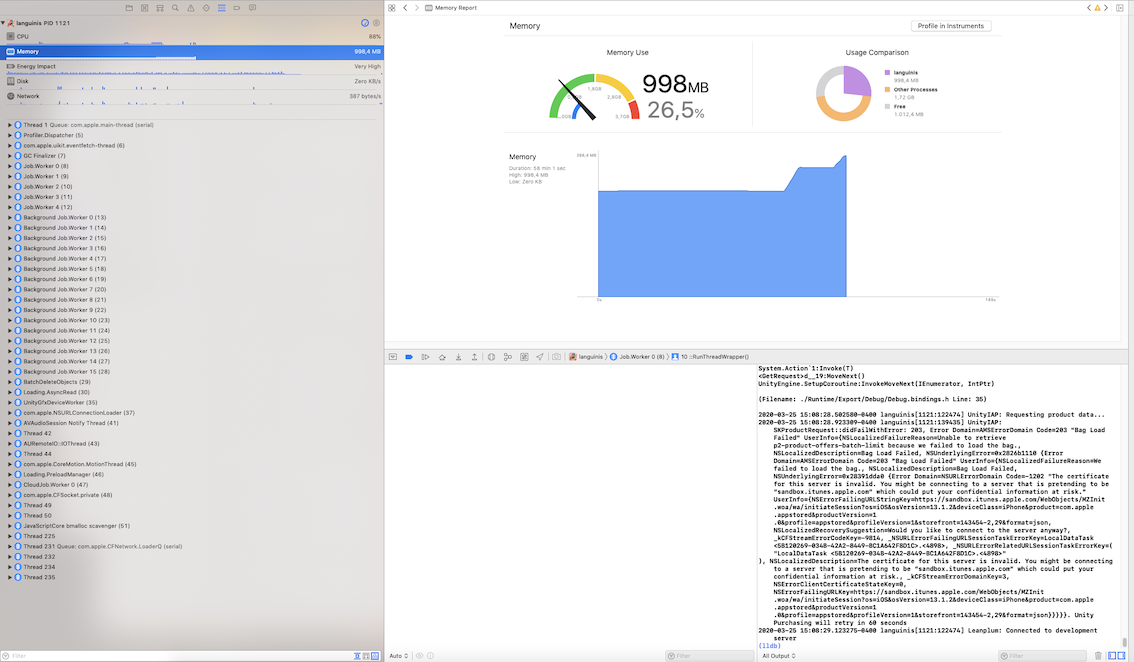
We have been experiencing some memory leaks on our project, and we have no clue about what is going on. It does not happen always, I've been trying to reproduce it but it only happens like once every few hours. There is no pattern on when it happens. I've tried to connect the iphone with the unity profiler and, the unity profiler does not show anything strange. But When connecting with Xcode we can see that the game starts increasing the memory until it reaches the limit and the SO closes it. (Take into account that those "steps" are only because I've tried to go step by step in the execution from xcode, but without pausing the execution is simply a ramp up until it crashes.
I've tried to connect the iPhone and use the unity profiler but unity profiler didn't show anything strange, it showed the normal memory usage.
We are using: Adjust, Facebook, Leanplum, Amplitude, IronSource Crashlytics (this crash does not appear there, because it ran out of memory, so it cannot save/send the crash). Unity 2019.2.13f1
I also uploaded the instruments alloc memory screenshot. 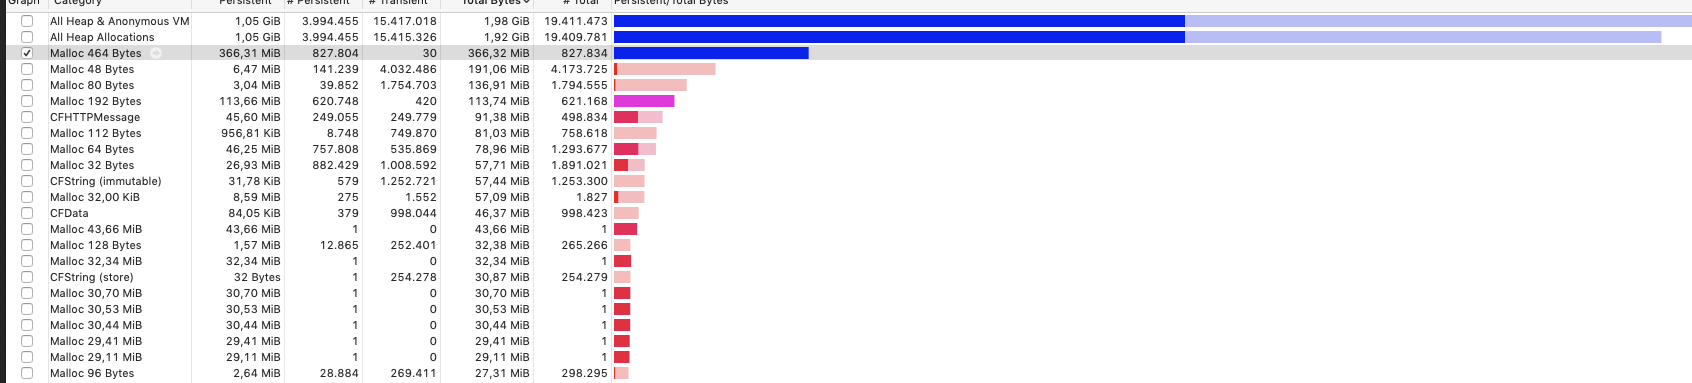 I've tried adding logs into Leanplum calls, and everything and I have no clue on how to solve it or which can be the problem. Anyone has faced the same problem?!
As I said, there is no pattern, sometimes simply having the game in the map menu without doing anything for few minutes and then it starts to consume a lot of memory.
I also attach: Instruments alloc screenshot.
We are using: Adjust, Facebook, Leanplum, Amplitude, IronSource Crashlytics (this crash does not appear there, because it ran out of memory, so it cannot save/send the crash). Unity 2019.2.13f1
I've tried adding logs into Leanplum calls, and everything and I have no clue on how to solve it or which can be the problem.
It should be revised as soon as possible.
In my case, memory leakage occurs when I change domain even though I am looking at the same server.
Were you able to find a resolution to the issue? We are having the exact same issue on iOS 14 devices . Every 1 to 30 $$anonymous$$utes of gameplay results in an explosive memory leak and subsequent crash.
We are having the same issue. Can't find the source, but whenever the leak starts we see these lines in the console:
 2020-04-13 10:54:16.042345+0300 coins[9258:3510682] [] tcp_input [C1.1:3] flags=[R] seq=721827828, ack=0, win=0 state=CLOSED rcv_nxt=721827828, snd_una=457955433
 2020-04-13 10:54:16.042611+0300 coins[9258:3510682] [] tcp_input [C2.1:3] flags=[R.] seq=1925316496, ack=2318857751, win=117 state=CLOSED rcv_nxt=1925316456, snd_una=2318857751
 2020-04-13 10:54:16.134318+0300 coins[9258:3510563] [] tcp_input [C1.1:3] flags=[R] seq=721827828, ack=0, win=0 state=CLOSED rcv_nxt=721827828, snd_una=457955433
 2020-04-13 10:54:16.141155+0300 coins[9258:3510563] [] tcp_input [C2.1:3] flags=[R] seq=1925316456, ack=0, win=0 state=CLOSED rcv_nxt=1925316456, snd_una=2318857751
 2020-04-13 10:54:16.498487+0300 coins[9258:3510613] [] tcp_input [C6.1:3] flags=[R] seq=1564791191, ack=0, win=0 state=CLOSED rcv_nxt=1564791191, snd_una=2431114689
 2020-04-13 10:54:16.498668+0300 coins[9258:3510613] [] tcp_input [C6.1:3] flags=[R] seq=1564791191, ack=0, win=0 state=CLOSED rcv_nxt=1564791191, snd_una=2431114689
We had the exact same error. Have you found the source of the issue?
Was there ever any resolution to this? I'm getting this bug now :(
We discover that one of our http calls (post call) that was sending a lot of info, was working fine 95% of the time, but some times, the connection was not close and the memory increases like cazy.
We log the WWWConnection.mm and UnityWeRequest.mm and we found the call and after avoid this call we decrease the issue by 70%. The issue is not solved but is very clear that are internet related and httpBodyStream related.
What unity version are you using?
Unity 2019.3.2f and 2019.3.9f both showed the same behaviour.
We are also sure that it has something to do with UnityWebRequest, the explosive leak always starts in conjunction with sending a POST request.
To add more info, we are using Kochava SDK, Facebook SDK, Ad$$anonymous$$ob SDK, Firebase SDK, but I don't believe they are to blame, the leak starts when calling the UnityWebRequest post SendRequest.
We aren't able to reproduce consistently, but we do get it often enough to be able to test solutions, none helped so far.
This is exactly what happend to us.
We are using: - Firebase SDK - Facebook SDK - Ironsource SDK (includes Ad$$anonymous$$ob SdK) - TPSDK - AdjustSDK - Amplitude SDK - and some other. But.. We test the app with NO SDK at all, just normal Post Calls from our game and it crashes. So i'm 100% sure that is not SDK related. We didn't found any problem with GET calls.
No solution found yet. We test with different IOS devices, and crashes with all of them, so is NOT IOS 13 related.
Hi, I have the same issue in my game. I communicate with server a lot and get a lot of data and parse it on my side and the memory is simply blowing up on iOS.
Were you able to resolve this issue somehow?
We are experiencing the same symptoms.
We have two domains through AWS.
One used CloudFront.
A Case: https://abc.abcd.net/
Another used the Global Accelerator.
B Case: https://www.abcd.net/
For A case, the symptoms are not found.
However, for B case, equally mad memory leak occurs.
So I guess there's some kind of bug based on the domain setting.
SEND 'POST' method every 30 seconds using /ping.
This problem does not always occur, but a certain probability leads to a sudden increase in memory.
About one out of every 5 to 10 POSTs occurs unconditionally.
We are using Load Balancer and therefore TLS and SSL certification.
It appears to be Unity or Apple's bug and needs to be corrected as soon as possible.
I'd like to formally report the bug, but I'm not sure exactly where Unity can report the bug and how I can get feedback.
I want someone's help. We're in a serious situation.
We are still having this issue. Do you know how to resolve?
@doubletapsoft I am not sure if this will help but what I did is that I run garbage collector in some places in my code.
I had some classes which were not inherited from MonoBehaviour and they were holding huge data chunks coming from DB in HashTables. I reset those HashTables and ran garbage collectors. Also, I changed the game architecture to create and destroy the UI prefabs based on what player clicks and manually reset/ cleared all the arrays/lists or Dictionaries that object was using. This reduced the RAM usage in game significantly.
There is one more thing you can do, you can use LZ4HC compression for iOS. Remove the unnecessary images from folders and if you have a number of images that are being used together you can create an asset bundle for them but remember to unload the asset bundle.
These steps reduced the memory usage on my side. Hop it helps.
