After 3-5 seconds overhead spikes and keeps taking up +60% of performance
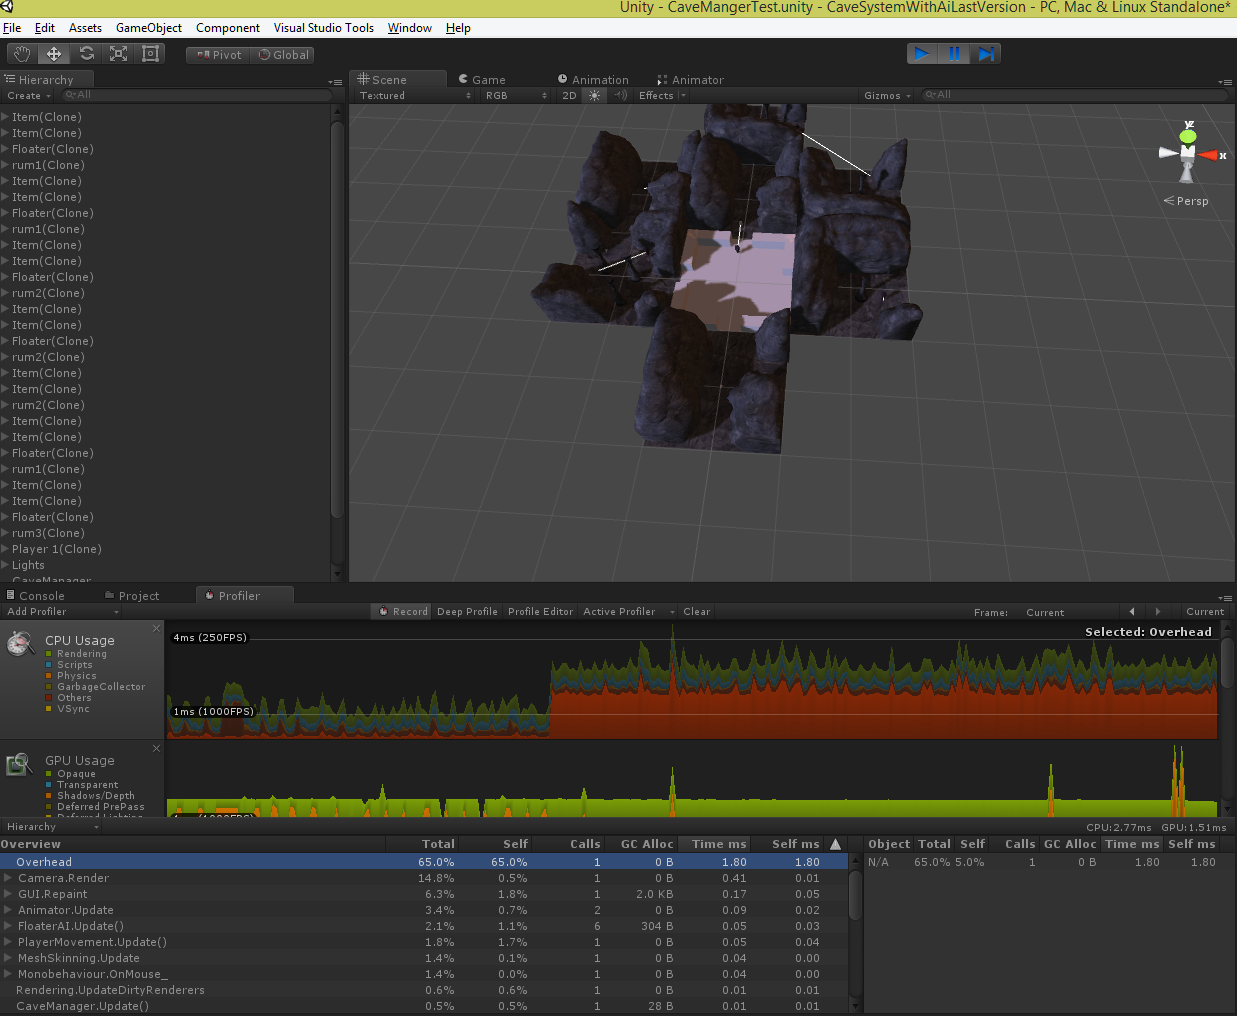
As you can see in the image, the overhead suddenly explodes and keeps taking up +60% of performance. This happens after 3-5 seconds in the game, even if i disable my spawn scripts...
Plzz help?
With that physic code spike, my guess is you leave out some loop or a big function in OncolliderStay ins$$anonymous$$d of OnColliderEnter/Exit.
@haico1992: That wouldn't make much sense as the spikes are mainly on the GPU, not on the CPU. Scripts are blue and there are no spikes or large areas. So it's the internal physx core that produces those spikes which is running on the GPU. Also if there is heavy code in OnCollisionStay you wouldn't get spikes but simply a raised script time during the collision. As i said, the scripting is watched seperately by the profiler.
$$anonymous$$ookaburra:
I don't see any reason to be concerned about those results. In the worst case there are still 250 frames per seconds. Also the overhead doesn't take 60% of the performance since it performs pretty well. The overhead takes up 60% of your frametime and as said below that's quite normal with such a low frametime in general. If you would run at usually 60 fps (with vsync for example) the same overhead here would only be around 10%- I think you misinterpreted the results a little bit ;)
As for the question "why" the overhead goes up after 3 seconds, that question needs to be directed to Unity Technologies. Since you have Unity pro you might want to contact the support, however your game doesn't look like ir's done or almost done so i wouldn't spend too much time on trying to optimise something that doesn't need to be optimised at all.
Overhead usually indicates the usage of CPU required to keep your scene up and running smoothly whilst running the rest of your code.
Try closing the scene view whilt you Run / Profile and see if you still have the same issues. If you don't, that's good for you, because after making a build you won't notice the Overhead performance decreasal.
Now, this amount of Overhead can be lowered by not looking at your entire level from afar in the scene, I take it that little area you have there is full of polygons and triangles. If you want to work in the scene, it's worth zooming in a bit to avoid poly-overload, or turning the camera away.
Here's a relative post to help you out a bit more. http://answers.unity3d.com/questions/13617/what-does-overhead-stands-for.html
In case closing the scene view doesn't help out as much, show me some of the code to see how clean it is :3
I hope that helps, feel free to ask further questions, may this already be satisfying enough, please accept the answer and go onwards with your programming journeys ^_^
This is why you should always try to profile on a build ins$$anonymous$$d of in the editor.
Also 1.8ms is not really something to be concerned about. $$anonymous$$eep in $$anonymous$$d that all percentages have to add up to 100%. If your scene doesn't require any resources, the point with the highest usage will take the lead. That's why your system-idle-process (on windows) takes 99% of your CPU usage because it has nothing else to do beside cycling though all threads.
The overhead can include various things. Have you tried a deep profile? In the screenshot you have the profiler set to "normal". Depending on your setup and what you're doing you might "stress" some subsystem that isn't watched seperately. Anyways a frametime of 2ms is 500 frames per second...
edit
Forgot to mention that the profiler itself causes some overhead. According to Heisenberg's uncertainty relationship it's not possible to measure the times without influencing them. To quote the Unity manual:
Note that profiling has to instrument your code. This instrumentation has a small impact on the performance of your game. Typically this overhead is small enough to not affect the game framerate
@ThePersister:
"show me some of the code"
That's pretty pointless as the scripting is watched by the profiler actually for each class.
With that physic code spike, my guess is you leave out some loop or a big function in OncolliderStay ins$$anonymous$$d of OnColliderEnter/Exit.
This is a weird one that might not work for every one, but if you're running a browser with flashplayer in the background, that can cause overhead spikes in Unity. I had regular spikes of about 10-12 ms in the profiler. Went down from ~90 fps to about 40 something. After closing all my browsers and restarting Unity, I now have a steady ~90fps. (This is all in an empty scene)
