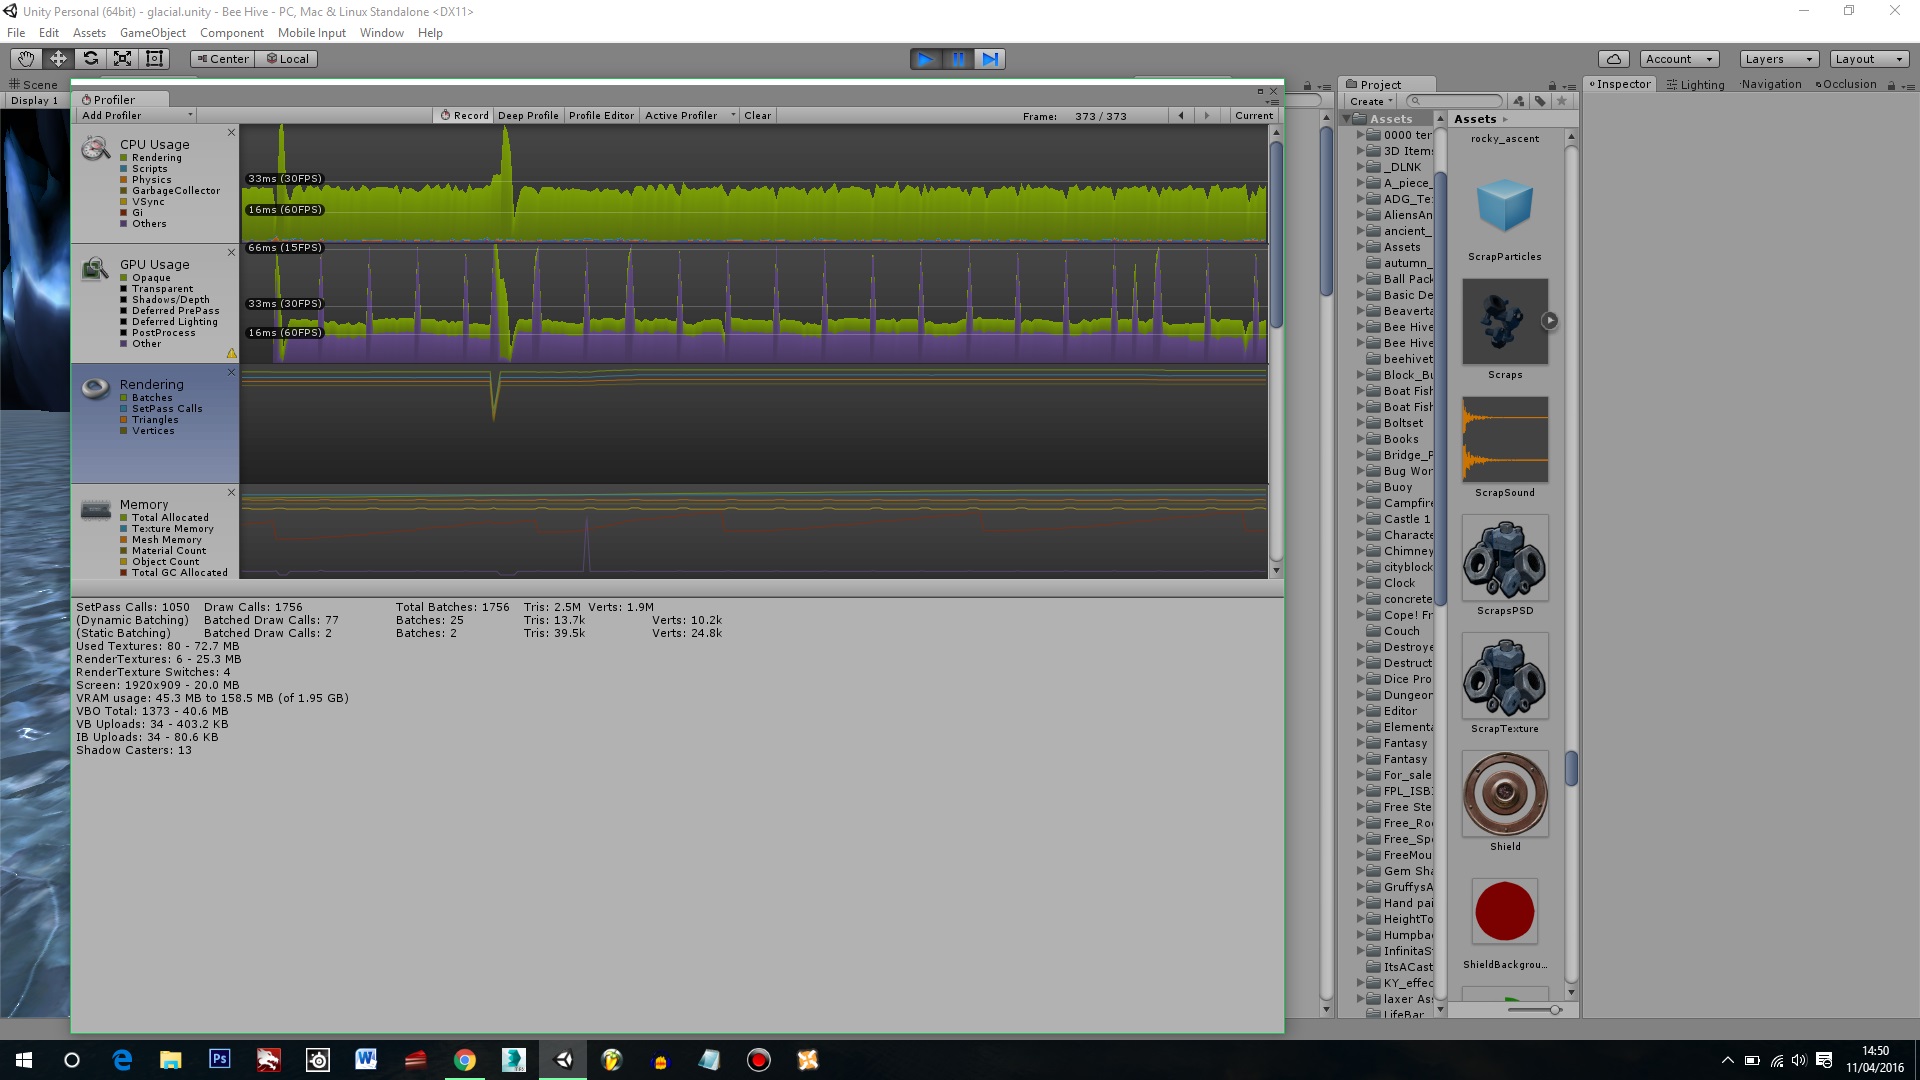
GPU spikes in profiler - used to be 100fps, now 30fps?
I have a question - I'm currently making a game and I'm getting pretty consistent spikes in the GPU according to the profiler. Now when I've opened the level previously, it used to average around 100fps without these spikes. I haven't changed anything in the level since then but when I restart the editor, I get these GPU spikes and it's killing my performance.
I've tried running it in both DX9 and DX11, enabling/disabling vsync, running it with "High performance NVIDIA processor" and tinkering with the resolution/AA/shadows... nothing has worked so far. No errors in the console either.
Does anyone have any ideas? I'm running a pretty high spec machine.
i7-4710HQ Quad core nVidia GTX 850M 8GB RAM
Any help will be very much appreciated!

Answer by AliCollinsJSY · Apr 11, 2016 at 02:05 PM
Just a bit of extra info, even when there are no objects in front of the main camera (just terrain and my character model), it still averages 30 fps ... the main cause of the performance drop is "Gfx.WaitForPresent" - I've investigated this issue before using the search but haven't found a solution - I believe Gfx.WaitForPresent is the issue here but I still don't know how to fix this.
SOLVED: If you're running into this issue and you're using an $$anonymous$$SI Laptop with an nVidia Graphics card, I've found the solution.
I've plugged my laptop into the mains and now the frame rate is back to 100 average. When your laptop is unplugged from the mains and depending on which nVidia card you have, sometimes the GPU goes into battery saving mode and Unity won't use it properly. When it is plugged in, it uses the entire GPU as nVidia detects it doesn't need to limit its power.
Your answer

