Question by
panthersfan34 · Nov 28, 2018 at 01:26 PM ·
profilerdebuggingefficiencytroubleshootingcpu usage
Minimizing spikes in Profiler?
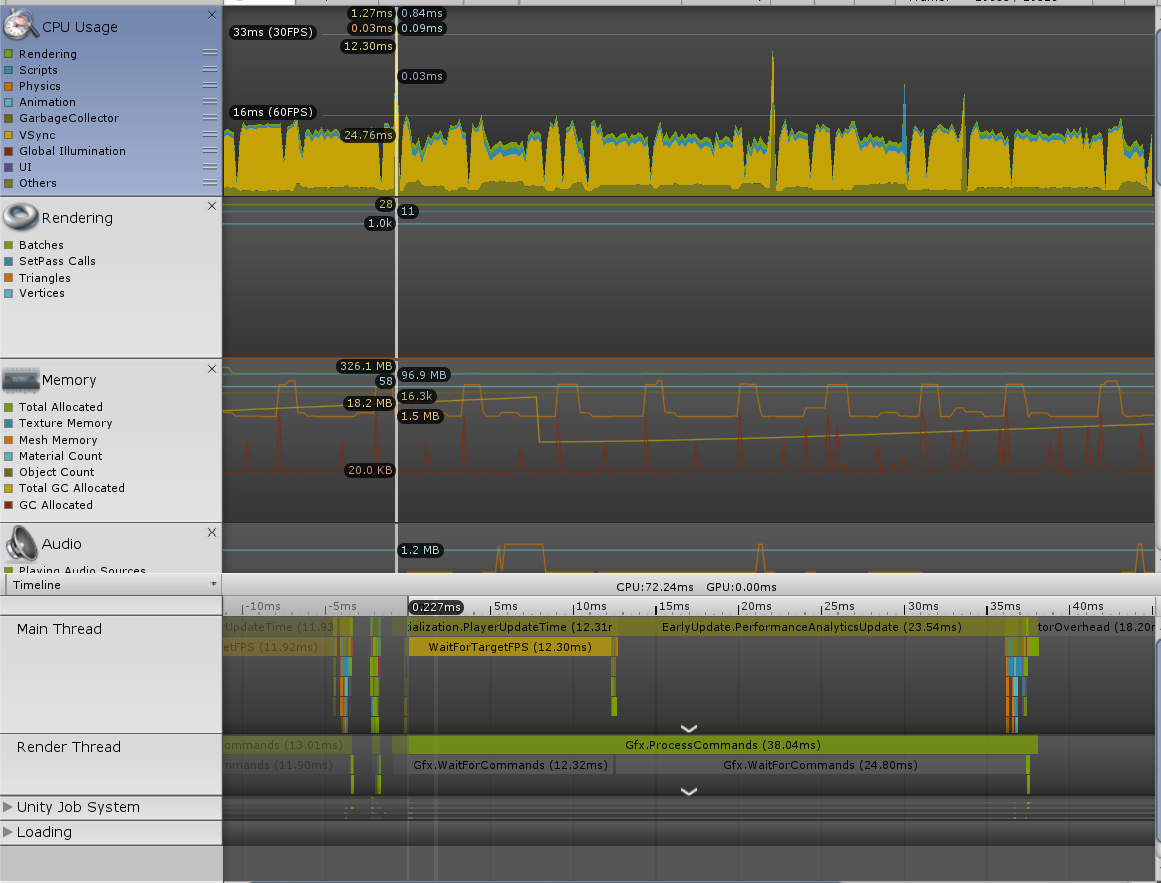
I keep getting random spikes when analyzing the Profiler. I tried to eliminate the number of objects that used the update function. Not too sure how to fix it, nor do I really understand what is going on. Any help/ suggestions would be great. Below is a picture of the Profiler. 
profiler.png
(162.5 kB)
Comment
Your answer

Follow this Question
Related Questions
GPU profiling time not adding up properly and GPU taking up lots of time 2 Answers
UpdateScreenManagerAndInput, which takes almost cpu usage in a profiler 2 Answers
Efficiency of accomplishing everything with fewer scripts 1 Answer
Semaphore Wait for signal accounts for 80% of total cpu usage. 2 Answers
Huge Physics Spikes (In empty scene and populated scene) 6 Answers
