- Home /
Bottleneck not shown in Unity Profiler
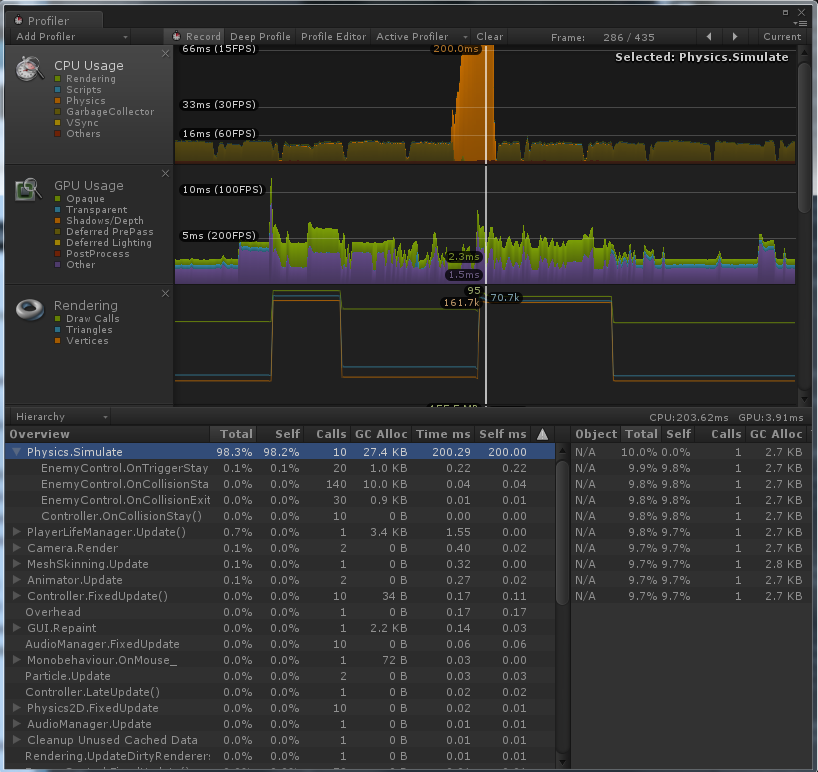
Hi, I started to make a game (I haven't yet created map ), and it's going slow. It's probably because of the instantiated enemies script, wich update the velocity vector of the rigidbody (direction towards the player). The problem is to find the bottleneck in the Profiler I get this:

It shows using the 98'3% of the CPU, fine, but where? xD
First of all thank you for answering or trying to answer. Another thing ... be grateful if someone could give me tips to optimize performance, or any good guide or tutorial to use the "Occlusion" or other optimization mechanics, since I'm new at this ^^.
Answer by Robacks · Feb 23, 2014 at 11:13 AM
There is an option called "Deep Profile". Its right to the Record button at the top bar of the profiler. You can even see it in your screenshot. Try to enable it and to recreate the problem. The output of the profiler is then much more detailed.
I suggest you to check your scripts if these do move objects around by using the transforms instead of using rigidbody functions. Read here more about physics.
For Occlusion you will find a lot of this in the documentation and formus i.e here. But sadly the current version of occlusion culling in unity (4.3.4f1) is broken preaty much. It still does the culling but also culls lights away which should be clearly visible. The next version of unity 4.x is about to fix these problems.
And as a side note if oyu thinkg about occlusion culling already, you shoould also read about "static and dynamic batching".
Your answer

Follow this Question
Related Questions
No me muestra el cuello de botella en Unity Profiler 1 Answer
Huge "other" in Gpu Profile ! 4 Answers
Animator.Update has high CPU usage 2 Answers
performance optimization 5 Answers
How do I get my game to run faster? 4 Answers
