- Home /
I dont know what EditorLoop is in my profiler?,I don't know what EditorLoop is in my profiler?
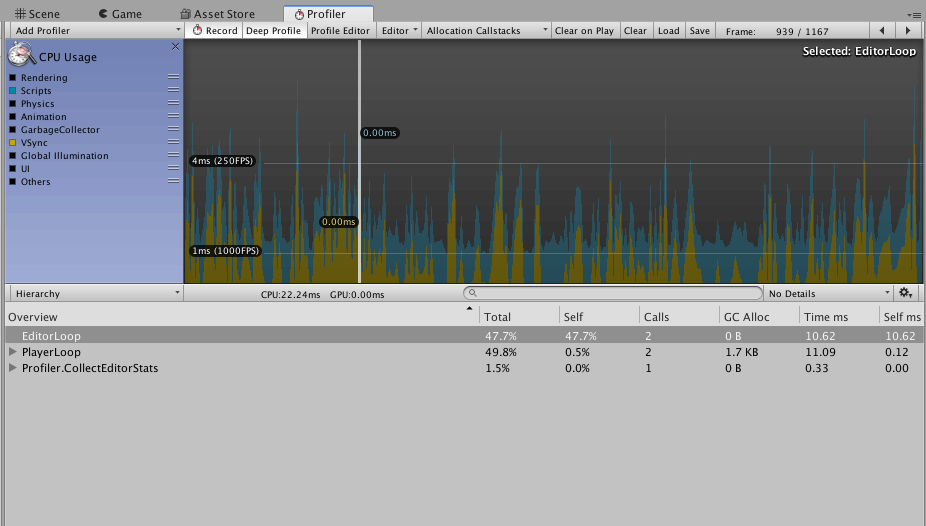
 I don't know what EditorLoop is in my profiler and it's using 10ms, which I think is a lot (kinda new to this) and don't know how to fix this. And the current problem im having in my game is that some OnTriggerEnter functions aren't working. My game involves multiple little AI with raycasts and stuff if that helps.
Answer by Nocktion · Feb 20, 2019 at 03:07 PM
EditorLoop in the profiler means the resources used by the UnityEditor itself. While running your game in the editor this overhead is added, but don't worry the standalone build won't have this overhead.
Answer by halivudestevez · Mar 17, 2021 at 09:30 PM
If you have 50% -98% profiler value for EditorLoop, try to close Scene editor windows. I spent a life with finding out what takes the FPS from 100+ to 20~.
Switching to the default layout (only one scene window), solved my problem.
(I leave this comment for everyone, who search for it on the internet.)
Thank you so so much. I would have never figured it out.
Oh dear... 5 years using Unity and I just realized you can have more than one scene window.
Your answer

Follow this Question
Related Questions
Editorloop spikes and FPS drops. 0 Answers
Check what's subtracting FPS? 1 Answer
Huge "Device.Present" performance hit in profiler 0 Answers
lock cursor code 1 Answer
Sprites performance issue 0 Answers
