Question by
Xpadrian2010 · Dec 14, 2015 at 10:54 PM ·
audiographaudiolistenerfilterhigh-low-pass
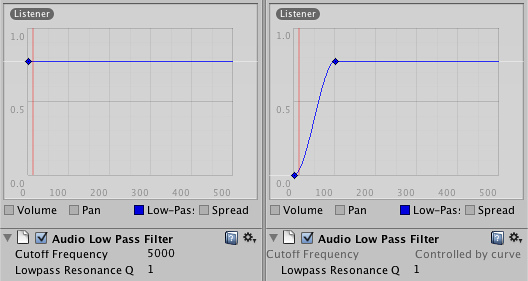
How can I represent the highpass filter with a curve like the lowpass filter?
How can I represent the highpass filter with a curve like the lowpass filter?
Anyone can, or know if there is a script that makes the graphic representation of the highpass filter in the listener graph.

class-audiolowpassfilter-0.jpg
(45.6 kB)
Comment
Your answer

