- Home /
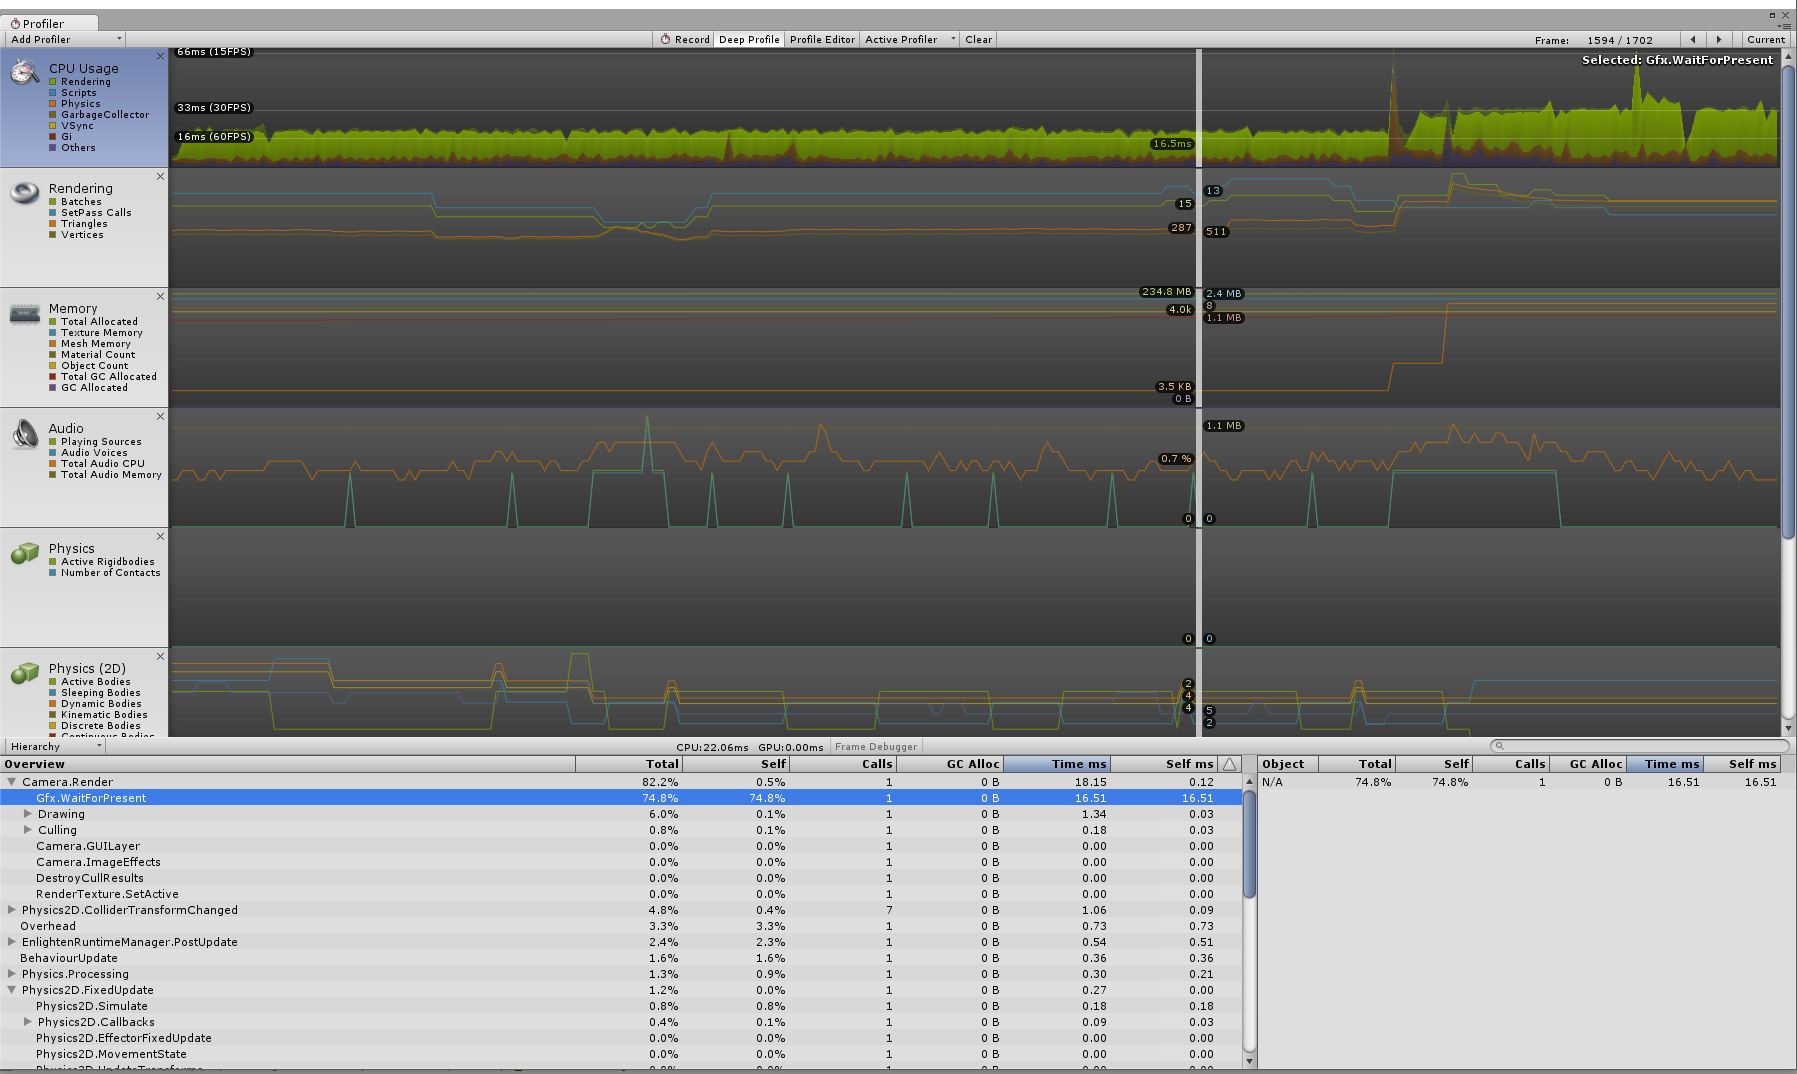
Gfx.WaitForPresent is limiting fps to 30-45 with Application.targetFrameRate = 60;
Unity 5.2.3f1 (Personal)
I have searched for fix enough but nothing worked. I'm building 2d arcade, VSync is off, correct usage of physics, not too much game objects, optimized sprites, sprites packed in atlases, i'm not using GetComponent<>() of GO.Find() in Update/FixedUpdate, etc.
Gfx.WaitForPresent just cuts performance.
I found that it's just time when everything is counted and rendered and system just waits, but I want it to render 60 fps, I don't want it to rest!
On different Nexus 5 2013 Android 6.0 runs smooth and fast but on Nexus 7 2013 Android 5.1.1, THL W810, Samsung Tab 8 (around 2013 year, dual core) and Samsung Galaxy S4 Mini runs with lags. This is very strange.
Please, help.
P.S. Selected in profiler frame - from gameplay, spikes after - pause and etc. 
Answer by alebasco · Dec 01, 2015 at 09:50 PM
In your case, it appears Gfx.WaitForPresent means that the CPU is waiting on the GPU to catch up. This means that all of your CPU work (physics, gameplay) is done, but the GPU is still trying to draw the frame, and is taking longer than the CPU took to do it's work. One is always going to be faster than the other, so if you're trying to figure out why your game is running slow, its important to figure out which is taking longer.
In the profile, I see you're looking at the CPU, and it seems to be running at a decent speed, so that would lead me to believe that the CPU is waiting for your GPU to catch up. To get some more data try enabling the GPU profiler. To do so, in the top left corner of the profiler, click "Add Profiler," and it should be present as an option there.
The GPU profiler should show you some handy things, but if the GPU is lagging, than that means you're trying to draw too much. Either you have too many objects, the objects are too high detail, or you have too many effects which force the objects to be drawn more than once. For instance, real-time shadows will draw your object extra times, in order to draw the shadow it casts. Some post processes will also take a lot of GPU space, and may result in drawing your objects extra times. In the newer versions, there is a Frame Debugger as well, which will allow you to look at everything that was drawn that frame.
If this information isn't enough, post the profiler with the GPU sections showing and we may be able to help more.
Your answer

