Question on Physics.Simulate Behavior
I'm noticing some very strange and unpredictable behavior in regards to Physics. Simulate and I was wondering if anyone had some insight as to what is going on:
I'm using Unity Pro version 4.7.1 and profiling both in-editor and on a variety of actual iPhones with the profiler attached. What I'm seeing are 'significant and unpredictable' spikes in both processing time and number of calls to Physics. Simulate during gameplay and I can't figure out why.
Example:
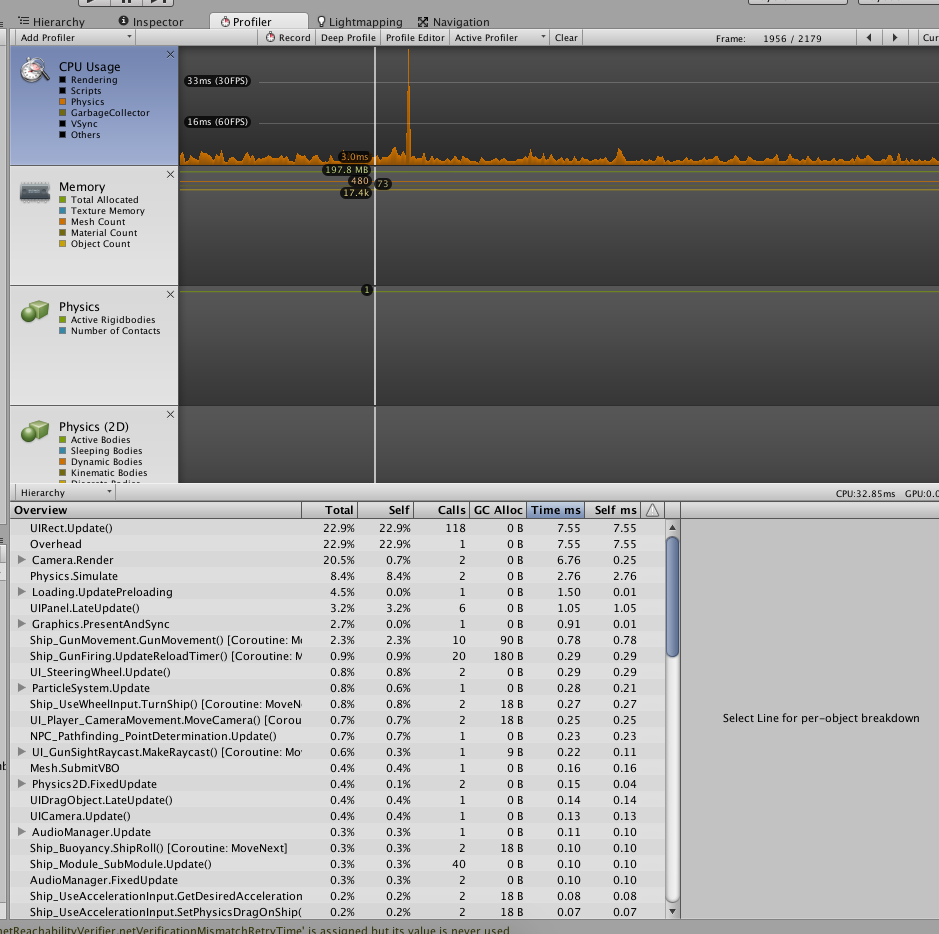
Typically what happens is both the number of calls to Physics. Simulate jumps (from say ~2-4 up to 15-20) while the processing time also jumps (from say ~5ms up to ~25ms). However, these two events are not always connected, so I can get high processing times with a low call number, and a high call number with low processing times.
These 'spikes' may occur every ~30 seconds to ~2 minutes, and the annoying part is that when I look at the Physics section of the profiler, the 'Number of active rigibodies / sleeping rigibodies / number of contacts / etc' is exactly the same before, during, and after these spikes (and the gameplay itself is 'static', meaning everything is idle). So I've got no idea as to what is causing this to happen.
Any ideas are appreciated, thank you for reading.
