- Home /
What causes an increase in editor GUI garbage collection?
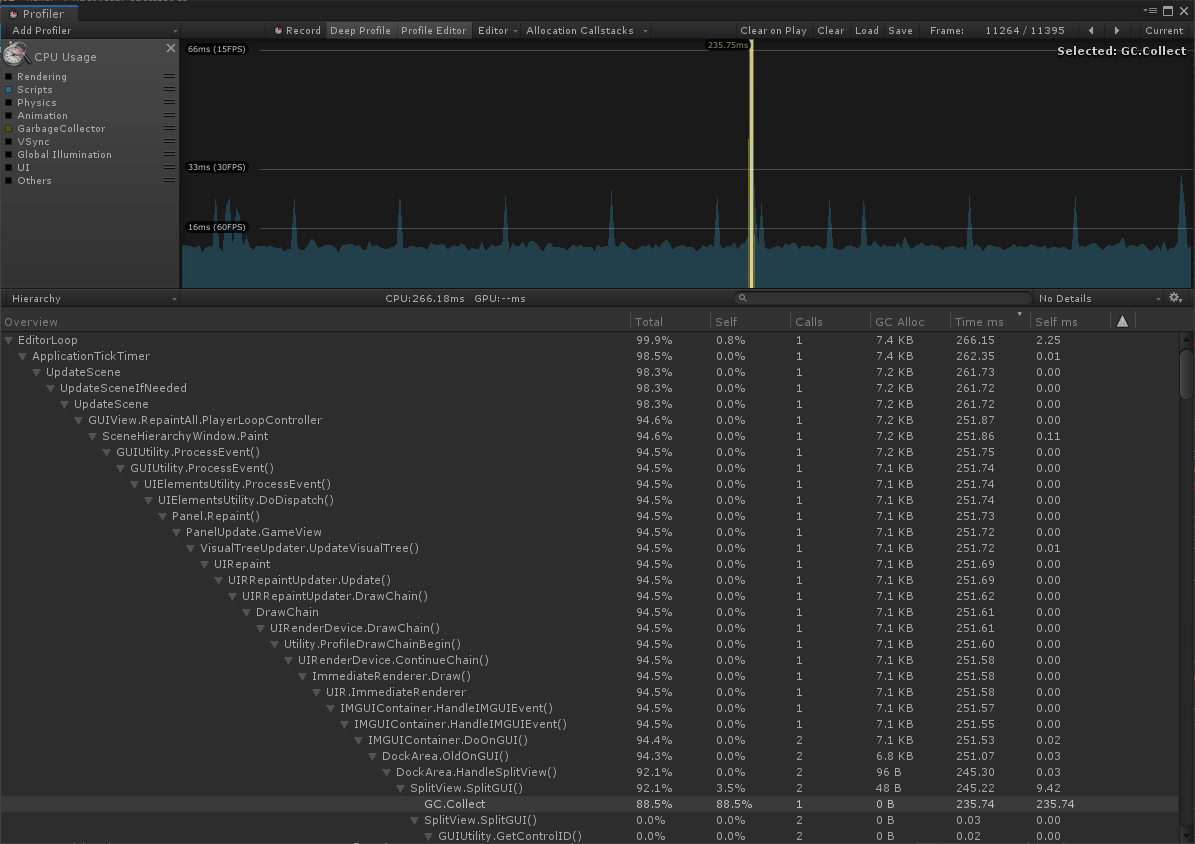
In editor, I see massive and regular spikes from GC.Collect which freeze the game for anywhere from 200ms to over 1000ms. These spikes do not register in the normal profiler mode, only when profiling the editor itself. These spikes (and game freezing) also do not occur in standalone builds at all, only when testing in-editor, and always related to GUI in some way. I do not have any UI in the scene, only a camera and meshes. Do you know what might be causing these huge spikes, and/or how I might fix this?
Full disclosure: this is part of a procedural, voxel prototype, which I know are prone to performance and memory management issues. I've done my best to structure the code to be performant, and limit unnecessary GC parsing of the heap, thanks to the profiler - that said, I can't rule out that something from gameplay isn't increasing the workload for the editor in some way, leading to this issue. I'm hoping that someone might be able to shed some light.
Sorry in advance if the formatting is bad, new lines aren't showing up in the preview...

It looks as though the GC calls are under I$$anonymous$$GUI for the Unity Editor itself; in particular the game view panel. I would imagine it's just part of how the game view is drawn/maybe even the profiler. Do you still get these spikes when running the scene normally, or only when profiling the game view?
No matter what windows I leave open or close, the spikes don't change. Even with the profiler not recording and closed. I did notice that changing my world's size (like "view distance" in $$anonymous$$inecraft) changes the severity of the spikes, but I just can't see/understand the connection between world size and editor GUI. Still runs perfectly in a build, but it makes testing in editor a challenge.
Answer by SmittyA · Jul 22, 2019 at 05:32 PM
I hope it's okay to answer my own question.
I tried testing with "Maximize on Play" enabled, and the hitches disappeared. This led me to realize that the panels themselves are triggering GC.Collect. More panels meant a more frequent spike. so it's not that it's not that I don't have the issue in a build, it's that the garbage collector simply isn't being triggered because the heap doesn't change after the initial load. I added a script to manually trigger GC.Collect, and sure enough, I get the same spike. I guess my code isn't as optimized as it could be. I hope this helps someone else seeing this issue!
Answer by marchall_box · Oct 17, 2021 at 08:51 AM
Hello,
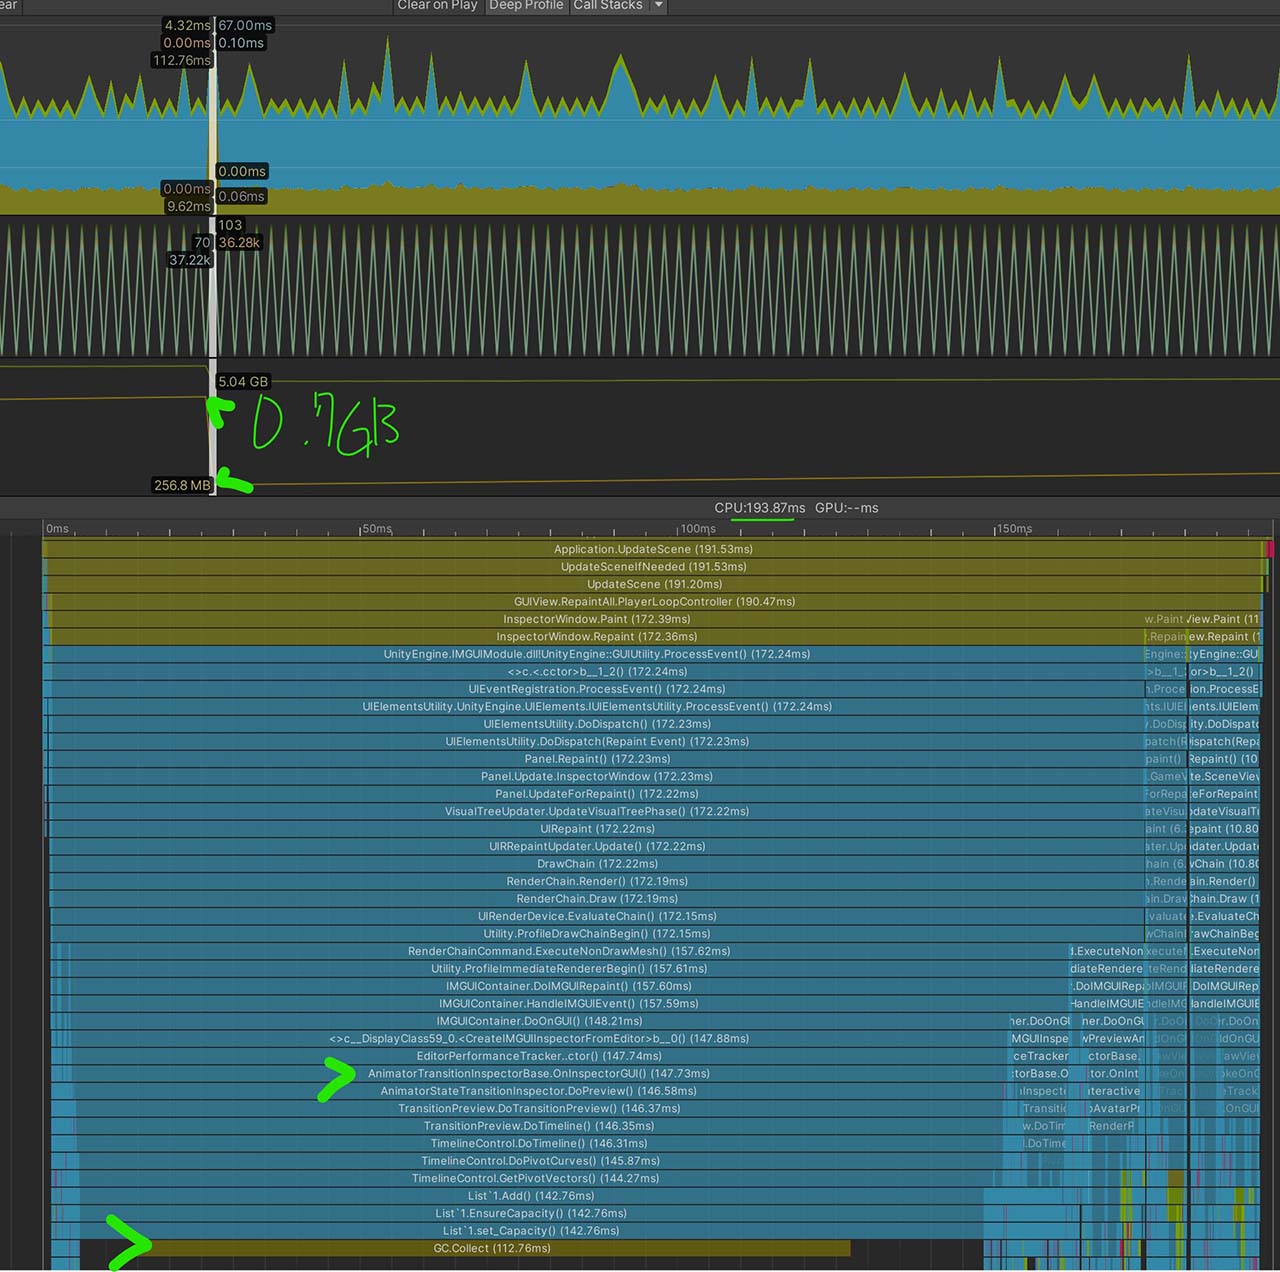
I am specifically noticing this on Unity 2020 LTS on editor while I have the Animation Transition GUI window open. 
I guess there is no really a solution but close/open the specific GUI window to reset the memory if the hiccup is getting bad?
Your answer

Follow this Question
Related Questions
Editor incredibly slow, weird profiler output. 1 Answer
HDRP Reflection probes cause terrible framerate 2 Answers
Suddenly low framerate issues 2 Answers
How to reset profiler data? 0 Answers
