- Home /
Unity profiler Gfx.WaitForPresentOnGfxThread
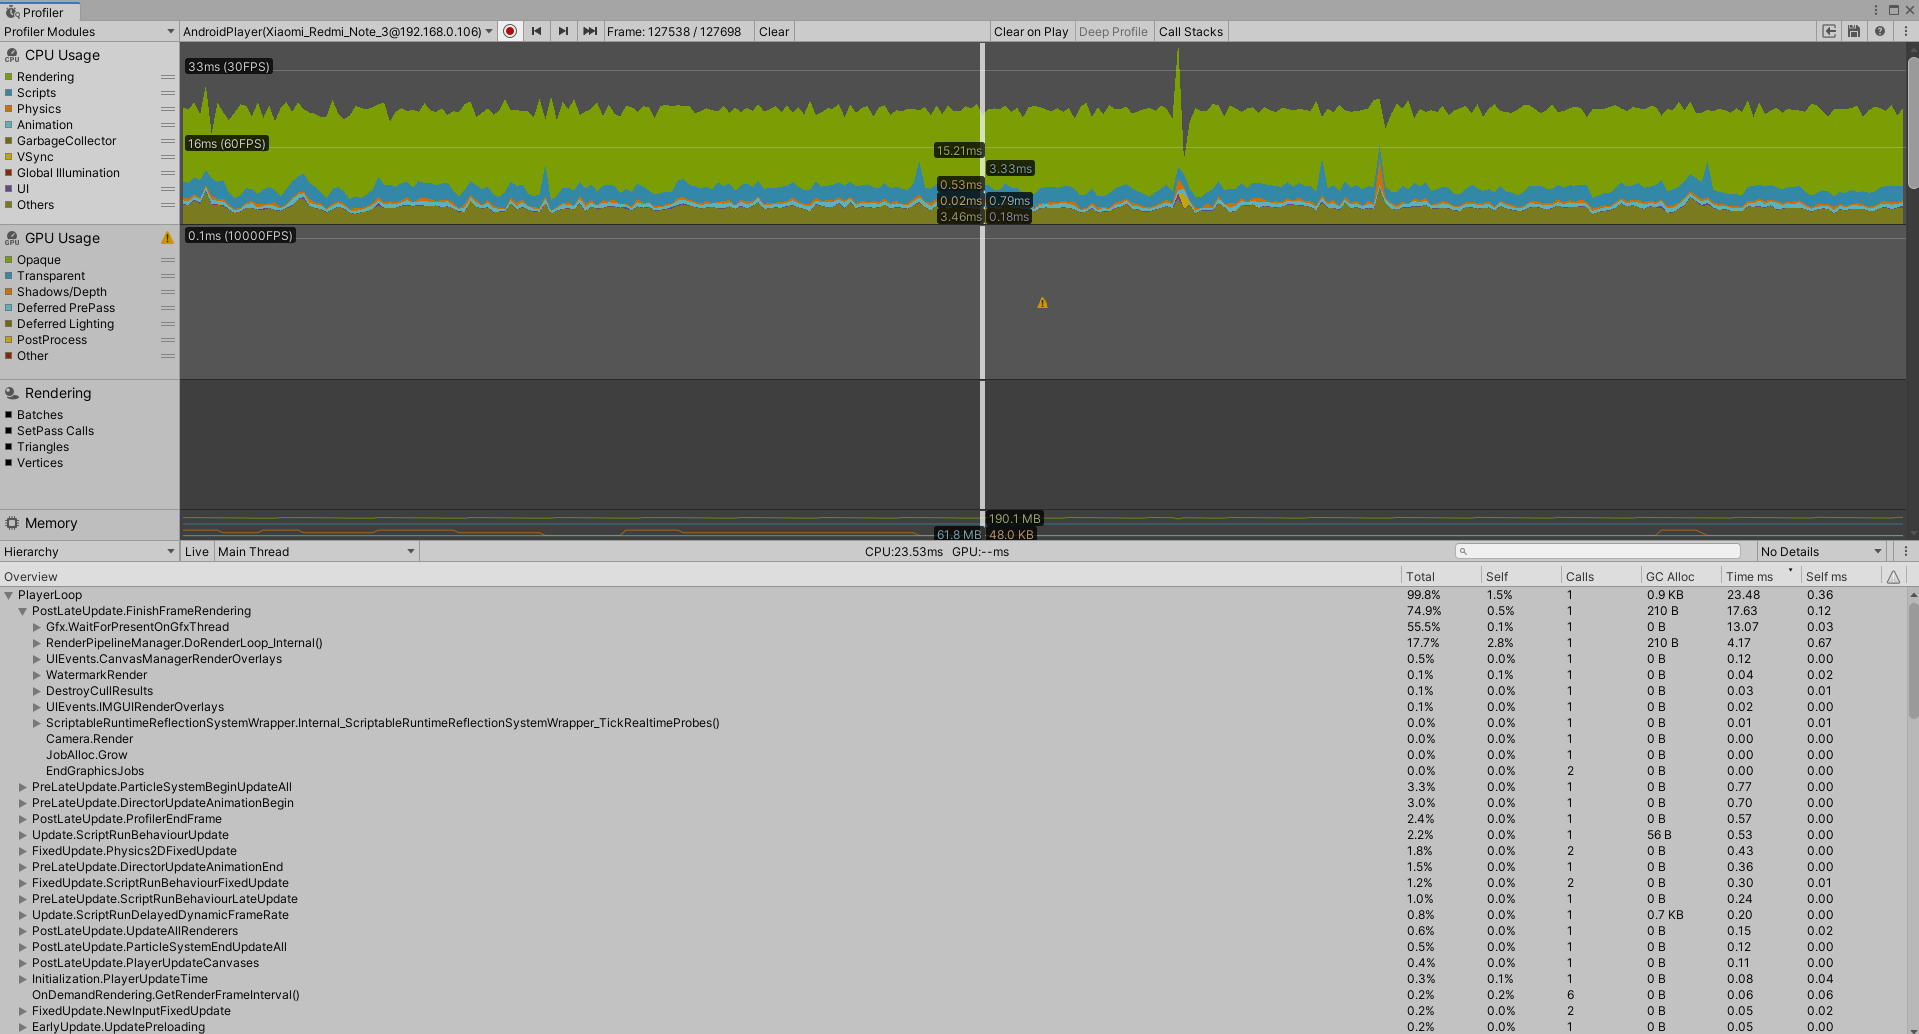
Hi, I am making simple 2D platformer game for Android, but I am getting poor performances on older mobile devices like Xiaomi Redmi note 3. I have no clue what to do with it. If someone do know please informe me about solution.
Profiler stats: Hierarchy 
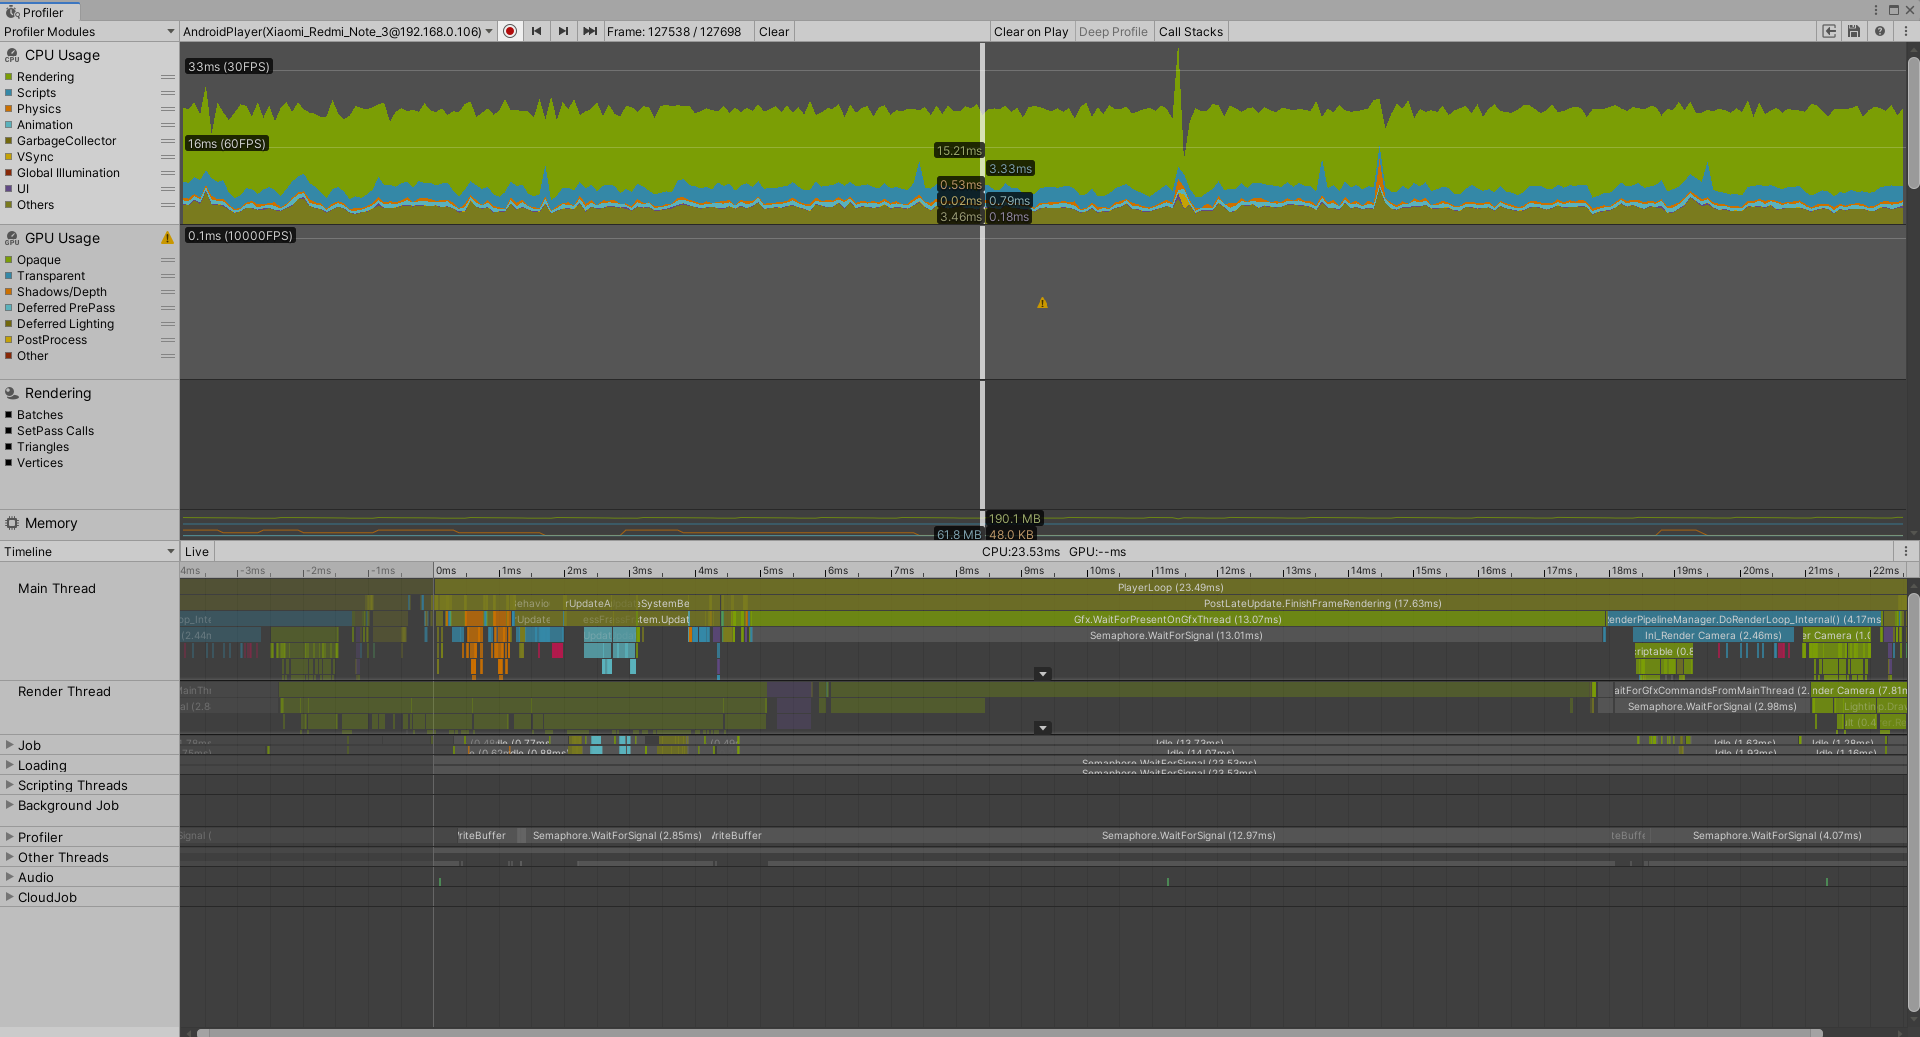
Timeline 
The only thing i noticed in profiler is Gfx.WaitForPresentOnGfxThread
Answer by Tikus · Jul 20, 2020 at 04:23 PM
Anyone please ? Literally have zero clue.
It is probably normal that WaitForPresentOnGfxThread takes the time it takes in the $$anonymous$$ainThread since it is waiting for work to be done in the RenderThread. Your problem is probably in that thread.
@rh_galaxy In Render Thread is Gfx.PresentFrame which takes about 11ms per frame and also Render Camera with 4-6ms per frame. Trying to do something about it for past month. Do you know what should i do to with that?
Answer by jppstudios · Mar 10 at 02:35 PM
I know its been a while, but i have the same problem. Did you happen to fix it?
Can you present a frame debugger timeline for the Render Thread?
Your answer

Follow this Question
Related Questions
GPU (render time) increase if screen size increase 1 Answer
Very Bad Performance on Android 3 Answers
Low FPS when launching the built apk first time 0 Answers
"Enable Internal Profiler" not working 0 Answers
How do I disable V Sync on Android 0 Answers
