Unity deep profiling is drunk, I think
Hey all,
I'm trying to remove all my performance hiccups in my game right now so I've started my 30 day trial of Unity pro and am using the profiler. The results I've gotten have helped me get my average frame rate up by a huge amount, pointing me in the direction of some naughty things I've forgot that I did in code. However the 'hiccups' are entirely still there and the results I'm getting don't make sense to me.
I can only upload two images for this question, but here are some imgur links if you want to see each of the non-repeating hiccups:
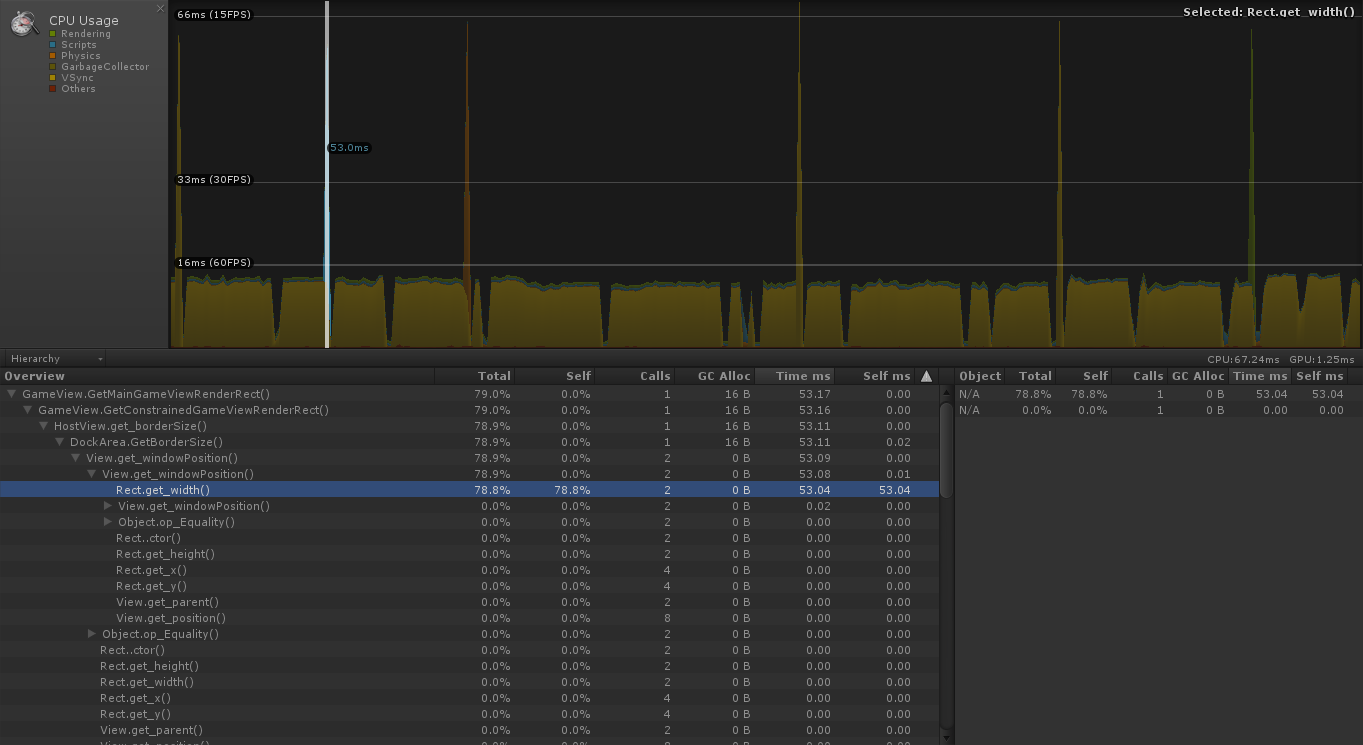
GameView.GetMainGameViewRenderRect
I also made a video, but I'm not sure how useful that will be.
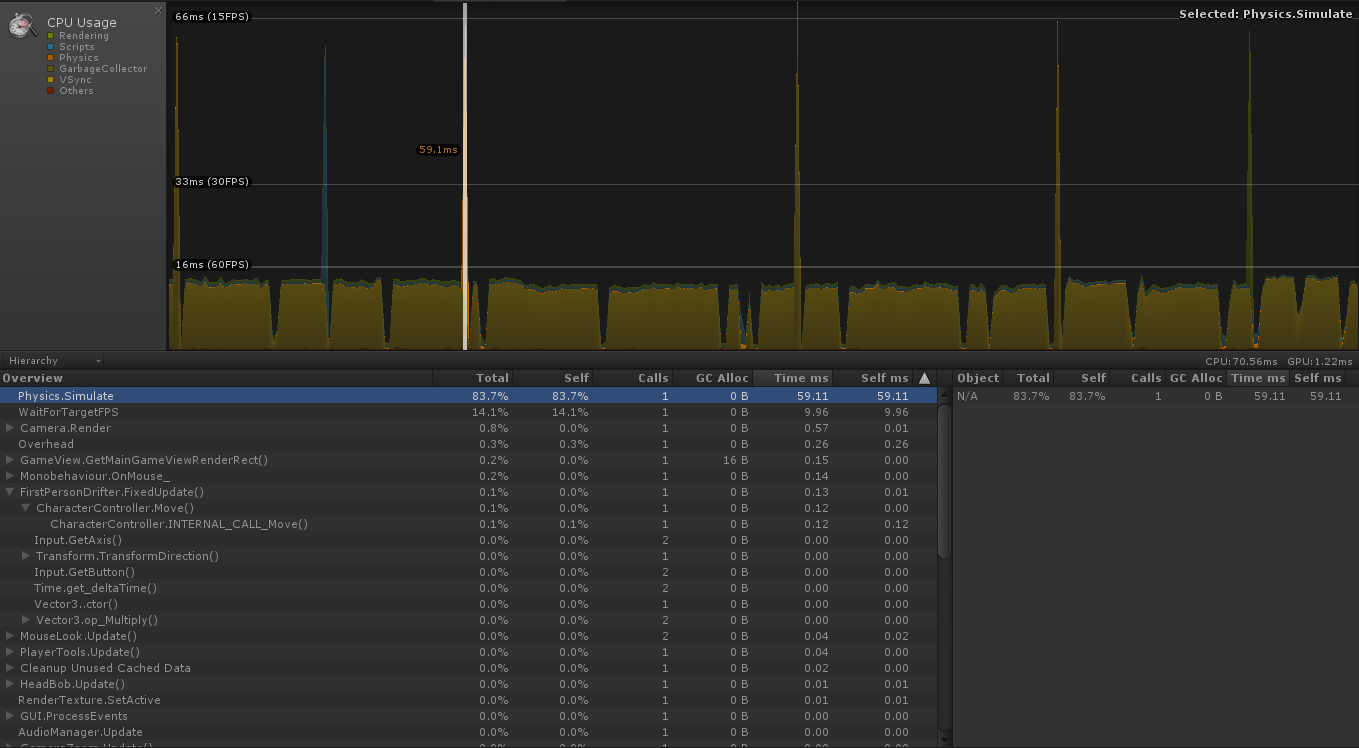
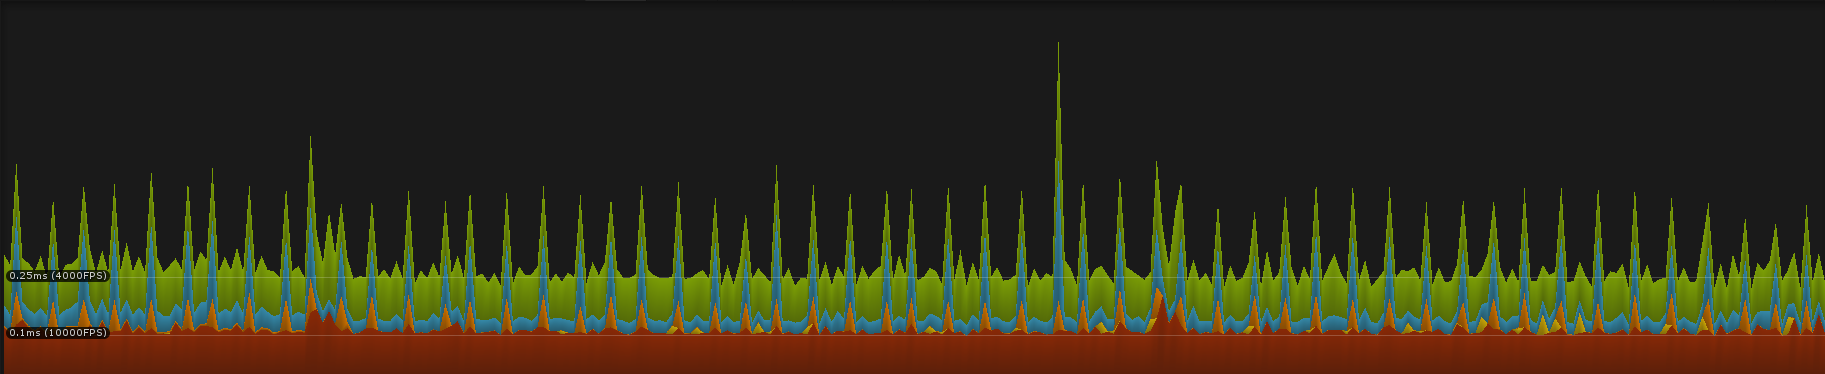
Just by scrubbing through in the profiler, I see on most frames both my CPU and GPU times are below 4ms put together, but once in a while I spike at about 100-200ms on some random function I'm not calling. I've played through dozens of times and I get seemingly random internal unity calls popping up at about the same pace (about once per second).
For instance: I have zero cloth simulation in my game and Physics.UpdateSkinnedCloth pops up sometimes?
Any ideas on what this could be or what I can do? I can post code for you guys but I'm not sure how much help it will be since nothing is pointing directly to an area of code.
Edit 1
I've made my repo public in case looking at source helps: https://github.com/xoorath/Farlands
Some of the bigger scripts that are running on update or fixed update include:
Assets/First Person Drifter Controller/Scripts/FirstPersonDrifter.cs
Assets/gameplay/ChunkManager.cs
Assets/graphics/world/ChunkRenderer.cs
The main scene in the root of assets is pretty plain.
Thanks!
Got a character with a cape? It got a rigidbody?
If you don't require it, search for the SkinnedCloth component alongside the Skinned $$anonymous$$esh Renderer and if you find one, delete it.
Nope, I've got a character with no mesh. It has a Character Controller component, and I've got a bunch of mesh collides in my scene (18 total, lots of verts - 73,000 verts total in the scene). No other physics entities.
Edit: if you're curious I can make my github repo public until solved. It's a pretty small code base, all things considered.
@meat5000 I've updated with the repo url and a brief layout of assets.
Crashes my editor
BlockSelectItem.prefab and the $$anonymous$$ain scene file.
I should have known... inexplicable weird stuff happening == threading issue.
I create 9 background threads for each voxel chunk in my game and they allocate and assign block values to a big matrix of cubes. Once done it calls back to the main unity thread where all the chunks are then sewn together for a big blob like linked list.
Anyways, the issue is that even though my threads weren't working on anything they were still running in the background - and since I'm a threading noob I probably forgot to do something important and/or messed something up pretty bad where my loop inside the thread was doing something bad.
@baste sort of tipped me off into the right direction by asking:
do you have a singlethreaded environment?
Which of course in my case is no. If anyone reads this and knows a good resource for safely calling back to the unity thread once done working in a background thread, that would be pretty great. I'll leave my repo open source for a while in case anyone wants to peak. The culprit file is:
And the fixing commit is:
Fixing the huge lag spikes caused by threadding.
^ note for future readers, these links may be unavailable. I do not intend to keep my project open source forever. The summary is that I had flipped a bool to false that I was using to keep the thread alive like if(alive){/*run thread*/} even though the body of that thread loop was doing nothing interesting, it was the culprit.
