- Home /
Question by
KaDaK4 · May 04, 2020 at 06:58 PM ·
shaderperformanceprofilermemory management
Shader.Parse overhead
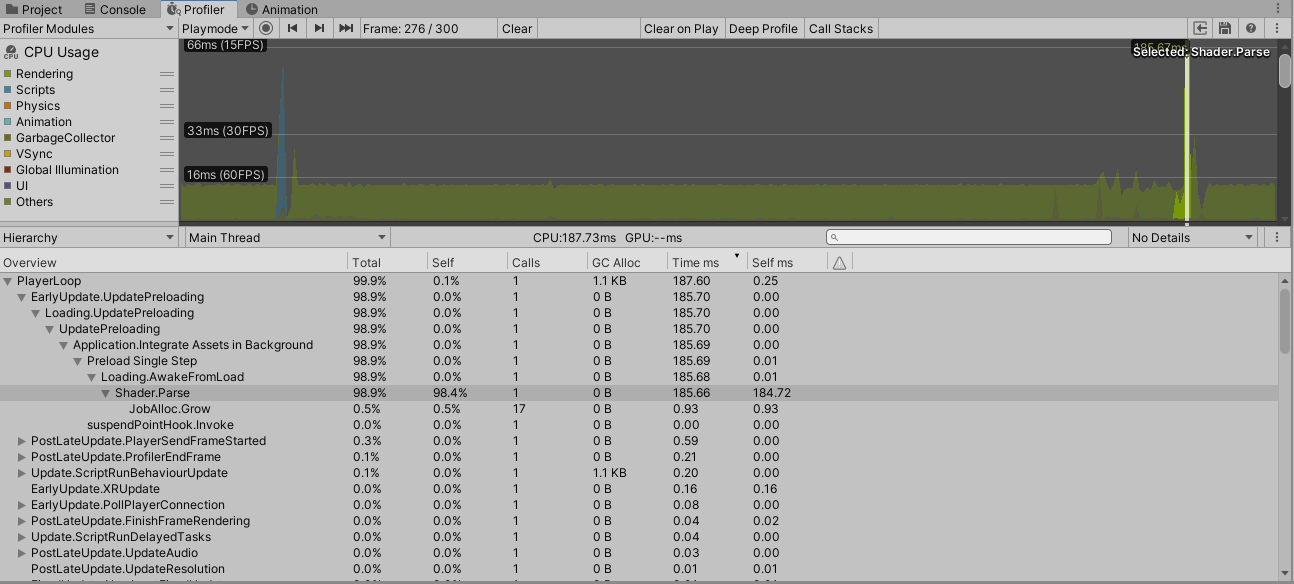
Hi guys, we are trying to make a system to load assets on oculus quest one by one using the addressable assets system so we can avoid low frame rate due to high asset loads. So far it is going well, but every time we load an FBX the profiler shows a performance peak caused by the Shader.Parse function(image bellow). What is it? Can it be avoided or reduced at all? I could't find any answers to this problem.
https://forum.unity.com/threads/shader-parse-taking-a-long-time-according-to-unity-profiler.746393/

shaderparsepeak.png
(91.4 kB)
Comment
Your answer

Follow this Question
Related Questions
Improving custom shader performance? 0 Answers
Unity Reservered Memory keep Increasing 0 Answers
Lowered general performance with Threads 1 Answer
Random FPS drop during gameplay 1 Answer
Shader performance question. 0 Answers
