|
|
|
Close Help | ||||||||||||||

Give your tests, worksheets, and presentations the professional touch. With GraphFree, you can quickly and easily create graphs of almost anything from high school math.

Right-click the graph to save or copy. (Trouble pasting? See the help.)
Drag labels/text with the mouse to reposition. (Hint: do this last, since updates to the graph will usually reset your changes.)
I taught math and physics for twenty years. Now I’m a stay-at-home dad for two adorable young children. If you could help this site bring in a little money for my family, I’d be very grateful.
And thank you to those who have supported me so far!

I taught math and physics for twenty years. Now I’m a stay-at-home dad for two adorable young children. If you could help this site bring in a little money for my family, I’d be very grateful.
And thank you to those who have supported me so far!
Many of you have provided helpful feedback about the new interface. I want to make GraphFree friendly enough that any math teacher can feel comfortable with it, while retaining the power that makes GraphFree distinctive. It’s not always easy to strike the best balance, but I think we’re getting closer.
Launched the completely rewritten GraphFree, designed for faster and easier use while still graphing doggone near everything you need.
The new GraphFree is designed for convenient keyboard use, making data entry faster in most situations. If there’s a button for it on a traditional calculator, there’s probably a way to type it now.
Don’t get hung up about whether or not to include spaces. They’re included in some of the examples to make them more readable, but they’re never required.
| Situation | What You Can Type |
|---|---|
| Exponents | 2^5, 3^(x+2), x^-3 |
| Square root | sqrt(x + 2) |
| Mathematical constants e and pi | pi, e, 5pi, e^x |
| Scientific notation, e.g., 2 × 10⁶ | 2E6, 4E-5 (Be sure to use a capital E!) |
| (x + 3)(x + 2) | (x + 3)(x + 2) No, you don’t need the multiplication sign. |
| Logarithms | log(1000), ln(e) |
| Log with different bases, e.g., log2x, | ln(x)/ln(2) (using the change of base formula) |
| sin2x | sin^2 (x) Of course, (sin(x))^2 still works if you’re used to those other calculators |
| Category | Available Functions |
|---|---|
| Basic Math & Algebra | abs (absolute value), sqrt (square root) |
| Logarithmic | ln (natural log) and log (base 10) |
| Trigonometric | sin, cos, tan, cot, sec, csc |
| Inverse Trigonometric | arcsin, arccos, arctan, arccot, arcsec, arccsc |
| Hyperbolic | sinh, cosh, tanh, coth, sech, csch |
| Inverse Hyperbolic | arcsinh, arccosh, arctanh, arccoth, arcsech, arccsch |
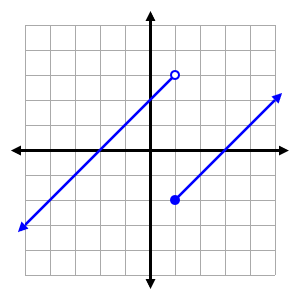
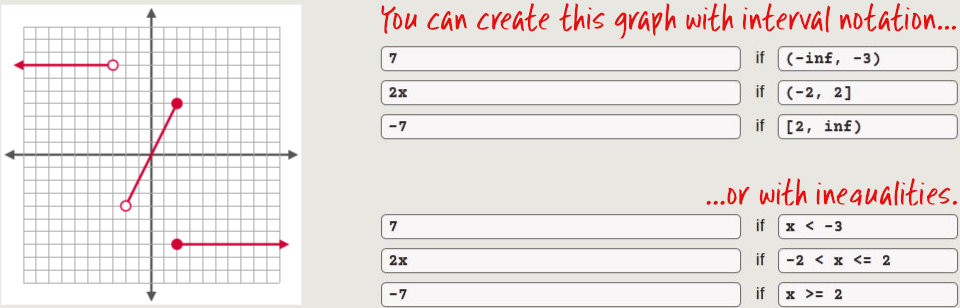
You may express the conditions of a piecewise function using either inequalities or interval notation. Infinite intervals can be expressed in interval notation using Inf for infinity.
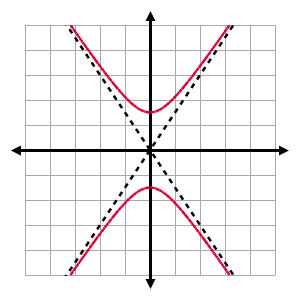
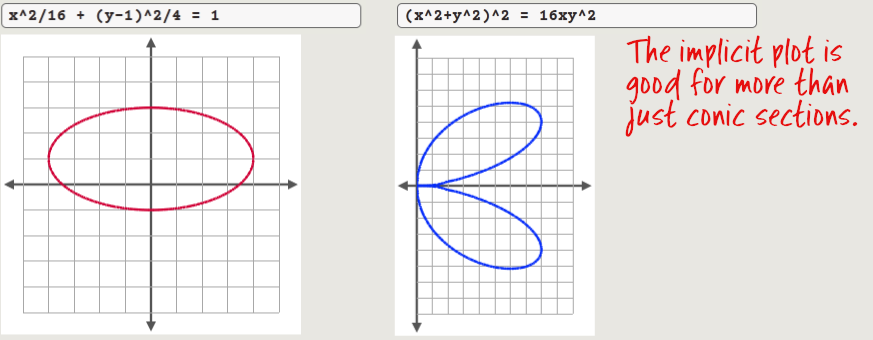
To graph conic sections, select the Implicit plot type and enter the full equation, equals sign and all. If you’re on a slow computer, be aware that the implicit plot type might take a little longer to run, especially if you set large values for the plot width and height.
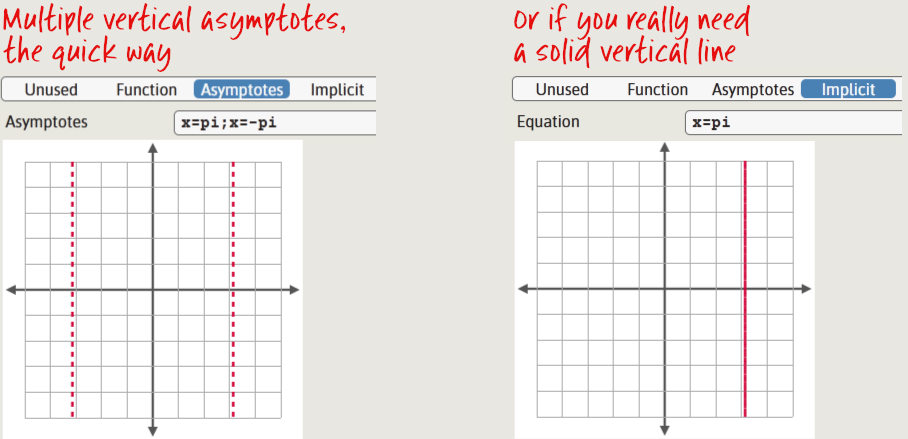
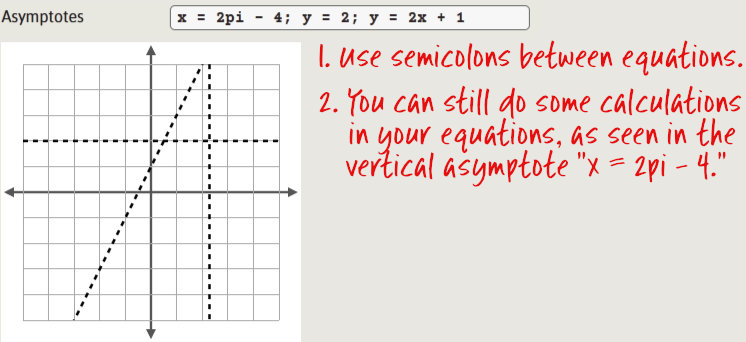
If you want a dashed vertical line for an asymptote, enter the equation (e.g., x = 4) with the Asymptote plot type. You can even enter multiple asymptotes at once.
If you want a solid vertical line instead, enter the equation in the Implicit plot type. In the implicit plot type, however, you can enter only one equation in each plot.
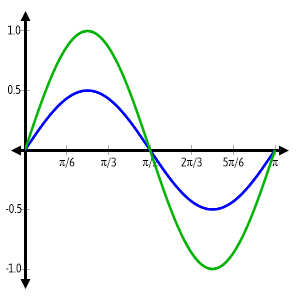
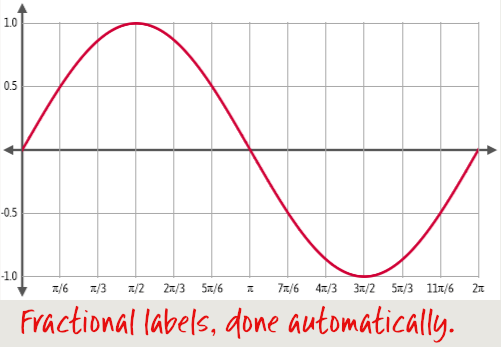
This grid type is perfect when your relevant x-values will be expressed in terms of π. With the Cartesian (Trig) grid type, you will enter the x-bounds of your grid in terms of π, and grid labels for the common fractions of π will display as exact values (e.g., π/6) instead of decimal approximations.
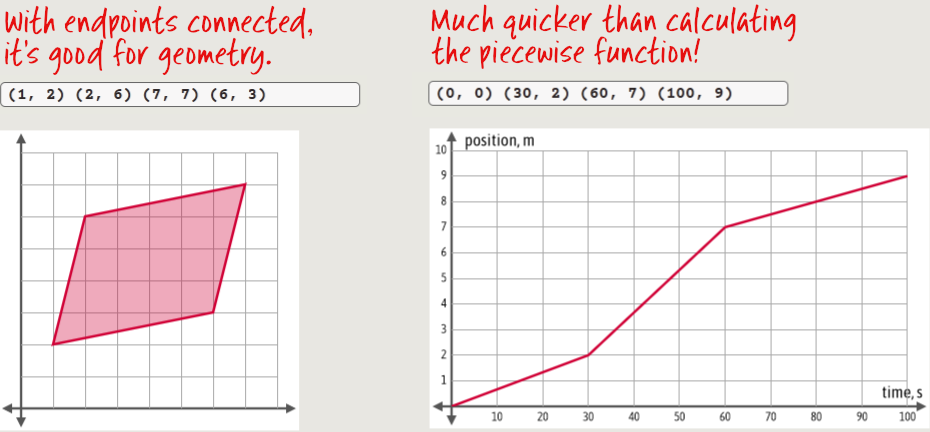
The new Polyline plot type has two quite different uses. One is to create polygons such as those that might be used in coorinate geometry questions. For this use, you will usually enable the Connect Endpoints option
Without the endpoints connected, the Polyline plot is great for creating some graphs that would be annoying to assemble as piecewise functions. Instead of specifying equations and intervals of the various segments, simply specify the points you wish to connect.
By the way, when you enter the ordered pairs, you really do need the parentheses.
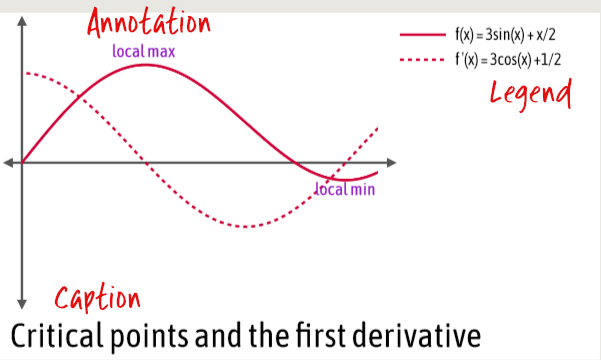
The caption, or title, appears below the graph.
The legend explains the meaning of different lines or scatter plot symbols. It appears either to the right of the graph or below it, depending on the width of the graph.
Annotations are used for any other notes you wish to add. You can use the mouse to drag them anywhere on the graph you wish. (For that matter, you can move the captions and legends too if you feel the need.)
You can get some special mathematical symbols using the button bar at the bottom of the captions panel. Click a button to copy the symbol to your keyboard, then paste (Ctrl-V) it into your text.
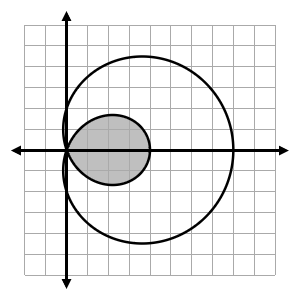
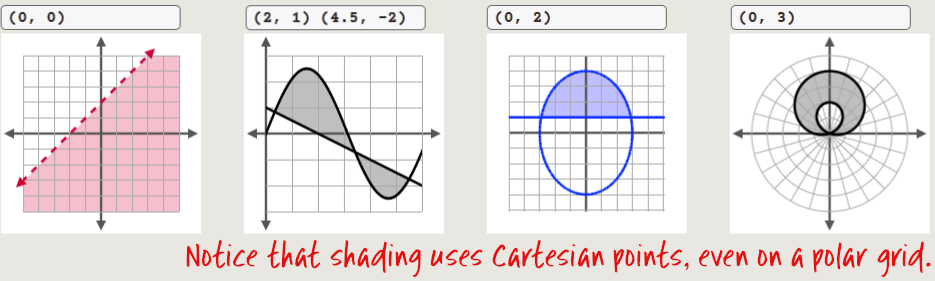
The new version of GraphFree makes it much, much easier to shade a region of your graph. All you have to do is specify an ordered pair inside each region you wish to shade.
All text in GraphFree—axis labels, grid labels, caption, legends, and annotations—is now movable. All you have to do is click and drag it with your mouse.
Do, however, make any other changes you wish to make to the graph before repositioning the text. This is because most changes you make to a graph will cause it to be redrawn from scratch, resetting the texts to their original positions.
You can use the Asymptote plot type to enter the equations of multiple horizontal, vertical, and/or slant asymptotes all in one line. The lines will appear dashed as is conventional for asymptotes. (If you don’t want dashed lines, used the regular Function plot type instead, or the Implicit plot type for vertical asymptotes.)
Since this plot type is designed specifically for asymptotes, you need to write the equations of the asymptotes in the “normal” way, which means x = c, y = c, and y = mx + b. Alternate forms usually won’t work.
This has changed slightly in the new GraphFree. Now, when you select Number Line as the grid type in the Axes & Grid panel, the plot panels will now contain number line inputs instead of the other plot types.
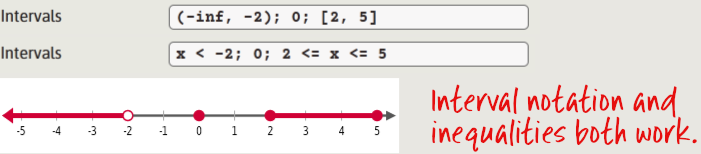
To enter data in a number line plot, you may enter multiple points and/or intervals separated by semicolons. Just as in the piecewise plot, you may use interval notation or inequalities to express your intervals. In interval notation, you may use inf to express an infinite interval.
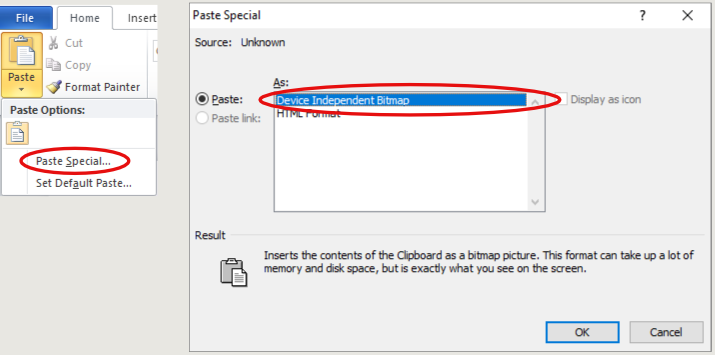
The usual procedure for pasting a graph—right-click, copy, then paste into your program—works exactly as expected in most programs. A few programs, however, need a little help to handle the pasting properly.
Microsoft Word can be one of those programs. If pasting into Word doesn’t seem to work, use the Paste Special command instead of the normal paste, and then select Device Independent Bitmap.
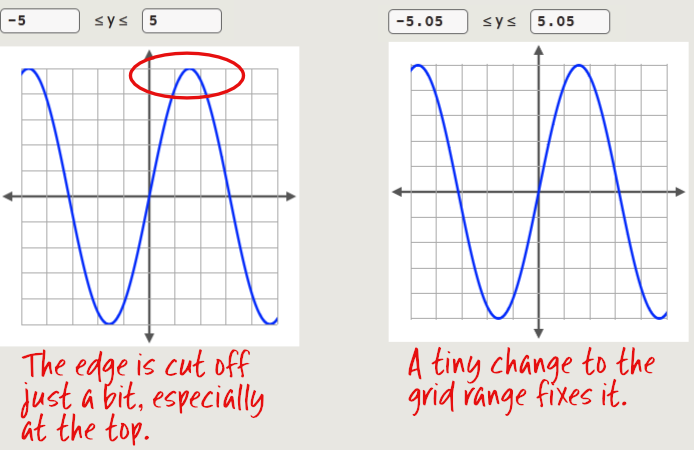
Graphfree is programmed to keep your graph from extending awkwardly beyond the edge of the grid and into the margins. Usually, that’s helpful. But once in a while you have a graph that just clips the edge of your viewing window, and that clipping effect looks a little bit off. Fortunately, you can compensate for it by extending the viewing window just a tiny bit.
Number lines cannot be shaded.